Exhibit 99.1
MaxLinear Investor Presentation September 2022
Disclaimer Cautionary Note Concerning Forward - Looking Statements This presentation contains forward - looking statements within the meaning of Section 27 A of the Securities Act of 1933 , as amended, and Section 21 E of the Securities Exchange Act of 1934 , as amended . Unless otherwise indicated, all forward looking statements are based on estimates, projections, and assumptions of MaxLinear as of the date of this presentation . These forward - looking statements include, among others, statements concerning : MaxLinear’s growth plan and strategies ; estimates of total addressable market and serviceable addressable market ; anticipated market trends (including growth trends) ; the potential of MaxLinear’s technology to be disruptive ; anticipated operating benefits for customers, suppliers and employees resulting from MaxLinear’s proposed acquisition of Silicon Motion (the “Merger”) ; industry trends, including, but not limited to, anticipated worldwide NAND demand ; anticipated total addressable market expansion as a result of the Merger ; anticipated financial performance of the combined company following the Merger ; and the anticipated closing date for the Merger . These forward - looking statements involve known and unknown risks, uncertainties, and other factors that may cause actual results to be materially different from any future results expressed or implied by the forward - looking statements including, without limitation : intense competition in our industry ; increasing supply chain risks within our industry, including increases in shipping and material costs and substantial shipping delays resulting in extended lead - times ; inflation trends in our supply chain and in the global economy generally ; geopolitical risks ; our dependence on a limited number of customers for a substantial portion of our revenues ; potential decreases in average selling prices for our products ; the risk that the potential benefits sought in the Merger might not be fully realized ; the possibility that the Merger might not be consummated, or that consummation might be unduly delayed ; the effect of public announcement of the Merger on Silicon Motion’s or MaxLinear’s sales and operating results and MaxLinear’s ability to retain key management, marketing, technical, and other personnel ; the substantial charges to be incurred in connection with the Merger, including costs of integrating the businesses and transaction expenses arising from the Merger ; the risk that despite the efforts of MaxLinear, key personnel of Silicon Motion might not remain employed with Silicon Motion following the closing ; certain restrictions on MaxLinear’s ability to operate during the pendency of the transaction and its ability to make certain acquisitions of any person or portion thereof ; and MaxLinear’s obligation under the merger agreement, including obligations to undertake certain mitigation measures that may be required to obtain applicable antitrust approvals and obligations to pay a termination fee under certain circumstances, in each case, subject to the terms and conditions of the merger agreement . In addition to these risks and uncertainties, investors should review the risks and uncertainties contained under the caption “Risk Factors” in MaxLinear’s filings with the Securities and Exchange Commission (“SEC”), including our Quarterly Report on Form 10 - Q for the quarter ended June 30 , 2022 , which we filed with the SEC on July 27 , 2022 . These slides do not constitute confirmation or an update of previously provided guidance . MaxLinear is under no obligation (and expressly disclaims any such obligation) to update or revise any forward - looking statements whether as a result of new information, future events, or otherwise . Additional Information and Where to Find It This communication is being made in respect of a proposed business combination involving MaxLinear and Silicon Motion . In connection with the proposed transaction, MaxLinear has filed with the Securities and Exchange Commission (the “SEC”), and the SEC has declared effective, a Registration Statement on Form S - 4 that includes a proxy statement of Silicon Motion and a prospectus of MaxLinear . The proxy statement/prospectus and this communication are not offers to sell MaxLinear securities, and are not soliciting an offer to buy MaxLinear securities, in any state where the offer and sale is not permitted . MAXLINEAR AND SILICON MOTION URGE INVESTORS AND SECURITY HOLDERS TO READ THE REGISTRATION STATEMENT ON FORM S - 4 AND OTHER DOCUMENTS PROVIDED TO SILICON MOTION SECURITY HOLDERS FILED WITH THE SEC CAREFULLY AND IN THEIR ENTIRETY WHEN THEY BECOME AVAILABLE BECAUSE THEY CONTAIN IMPORTANT INFORMATION ABOUT THE PROPOSED TRANSACTION . Investors and security holders are able to obtain the Registration Statement on Form S - 4 free of charge at the SEC’s website, www . sec . gov . Copies of documents filed with the SEC by MaxLinear (when they become available) may be obtained free of charge on MaxLinear’s website at www . maxlinear . com or by contacting MaxLinear’s Investor Relations Department at IR@MaxLinear . com . Copies of documents filed or furnished by Silicon Motion (when they become available) may be obtained free of charge on Silicon Motion’s website at https : //www . siliconmotion . com or by contacting Silicon Motion’s Investor Relations Department at IR@siliconmotion . com . Non - GAAP Financial Measures This communication may contain certain non - GAAP financial measures, which MaxLinear management believes are useful to investors and reflect how management measures MaxLinear’s business. Further detail and reconciliations between the non - GAAP financial measures and the GAAP financial measures are available on the Investor Relations section of MaxLinear website as part of its published financial results press release. Because of the inherent uncertainty associated with our ability to project future charges, particularly those related to stock - based compen sation and its related tax effects as well as potential impairments, we do not provide reconciliations to forward - looking non - GAAP financial information. 2
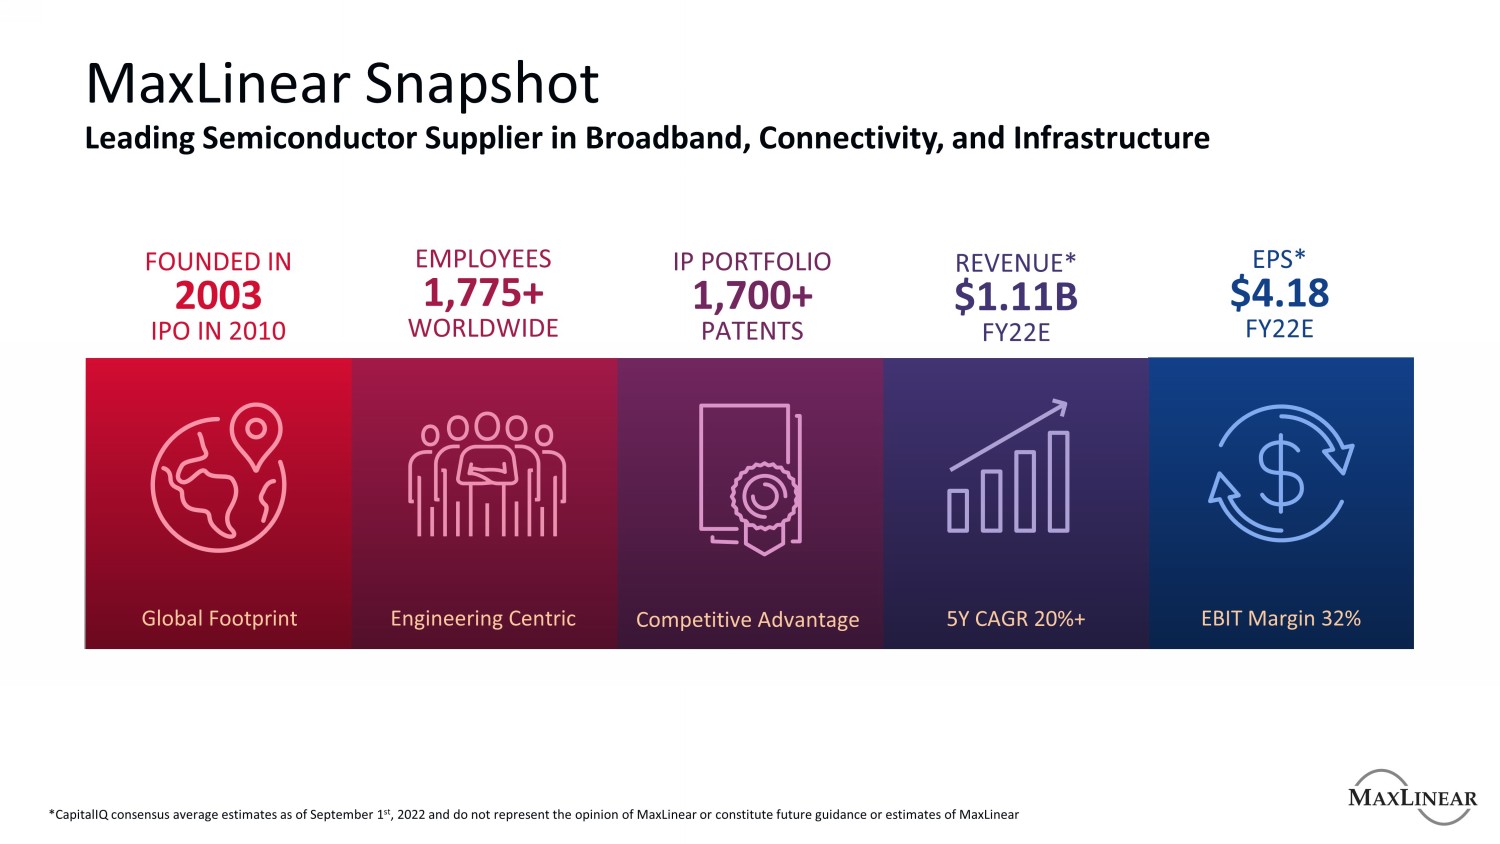
MaxLinear Snapshot Leading Semiconductor Supplier in Broadband, Connectivity, and Infrastructure FOUNDED IN 2003 IPO IN 2010 EMPLOYEES 1,775+ WORLDWIDE IP PORTFOLIO 1,700+ PATENTS REVENUE* $1.11B FY22E EPS* $4.18 FY22E Global Footprint Engineering Centric Competitive Advantage 5Y CAGR 20%+ EBIT Margin 32% *CapitalIQ consensus average estimates as of September 1 st , 2022 and do not represent the opinion of MaxLinear or constitute future guidance or estimates of MaxLinear
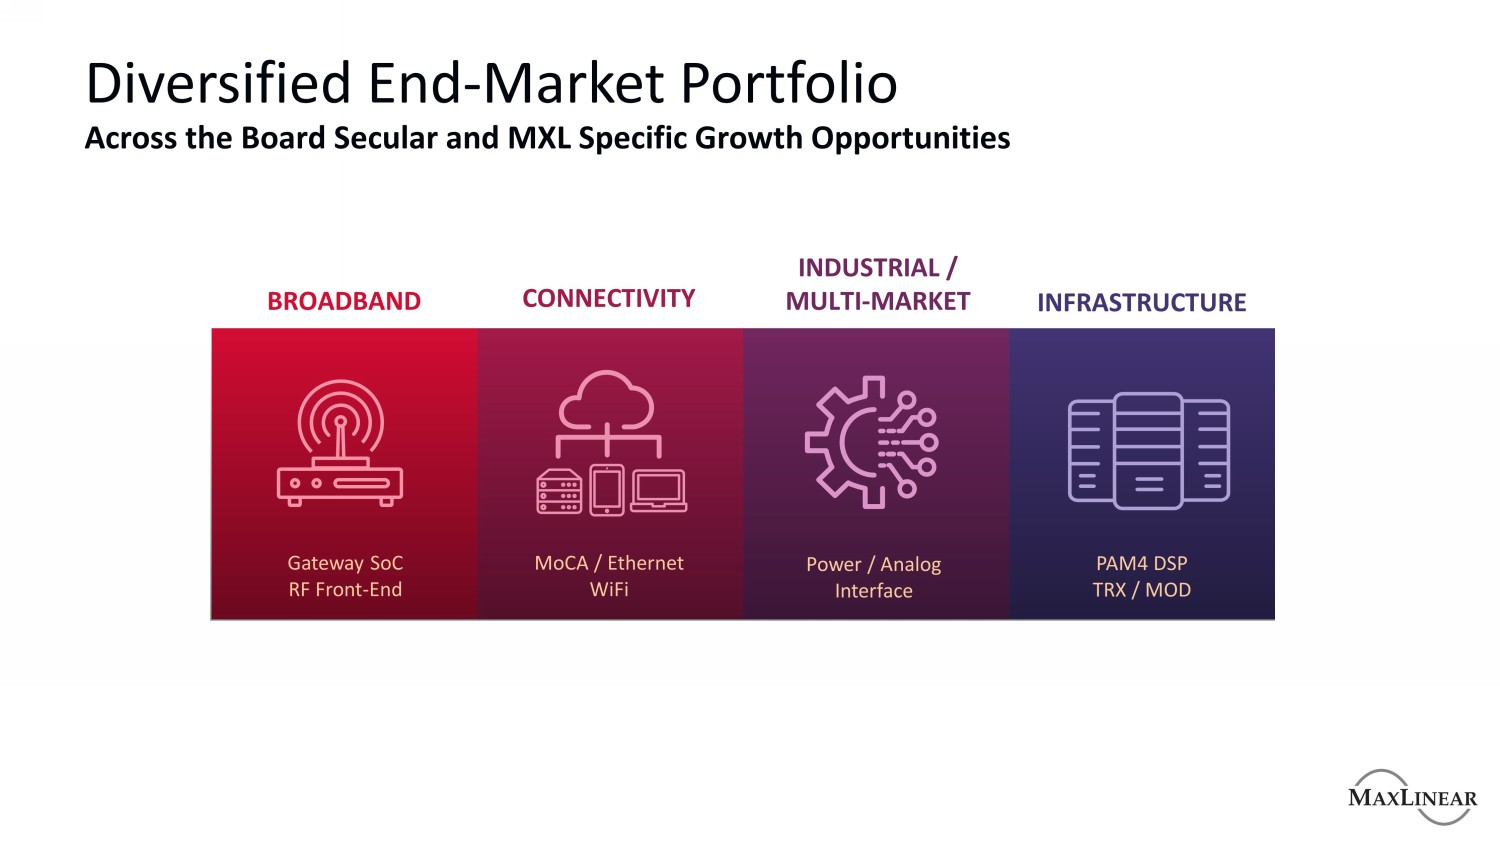
Diversified End - Market Portfolio Across the Board Secular and MXL Specific Growth Opportunities BROADBAND CONNECTIVITY INDUSTRIAL / MULTI - MARKET INFRASTRUCTURE Gateway SoC RF Front - End MoCA / Ethernet WiFi Power / Analog Interface PAM4 DSP TRX / MOD
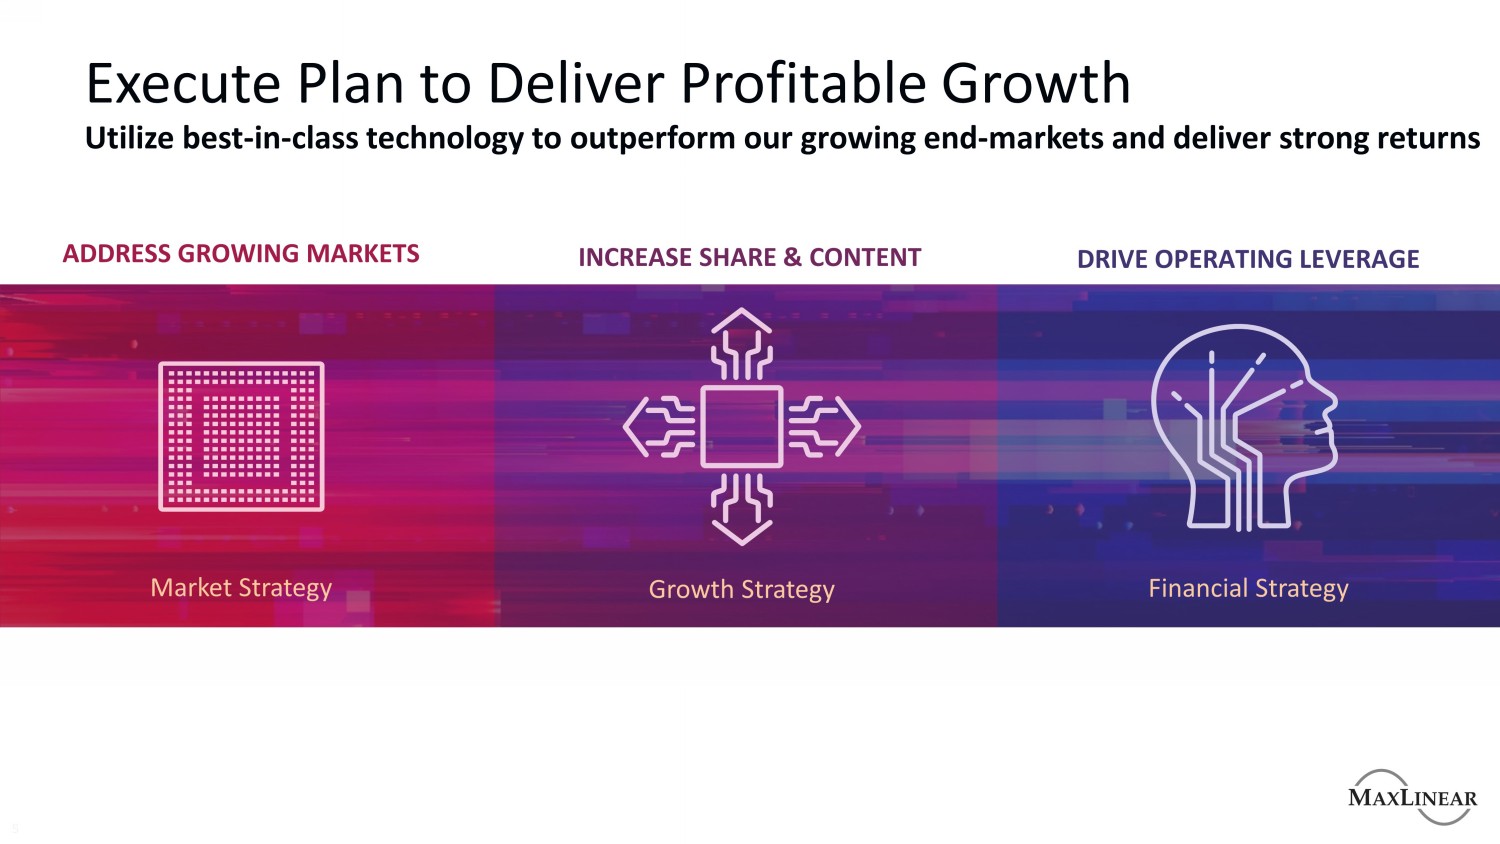
ADDRESS GROWING MARKETS INCREASE SHARE & CONTENT DRIVE OPERATING LEVERAGE Execute Plan to Deliver Profitable Growth 5 Utilize best - in - class technology to outperform our growing end - markets and deliver strong returns Market Strategy Growth Strategy Financial Strategy

Market Strategy Target & Address Dynamic Growth Markets
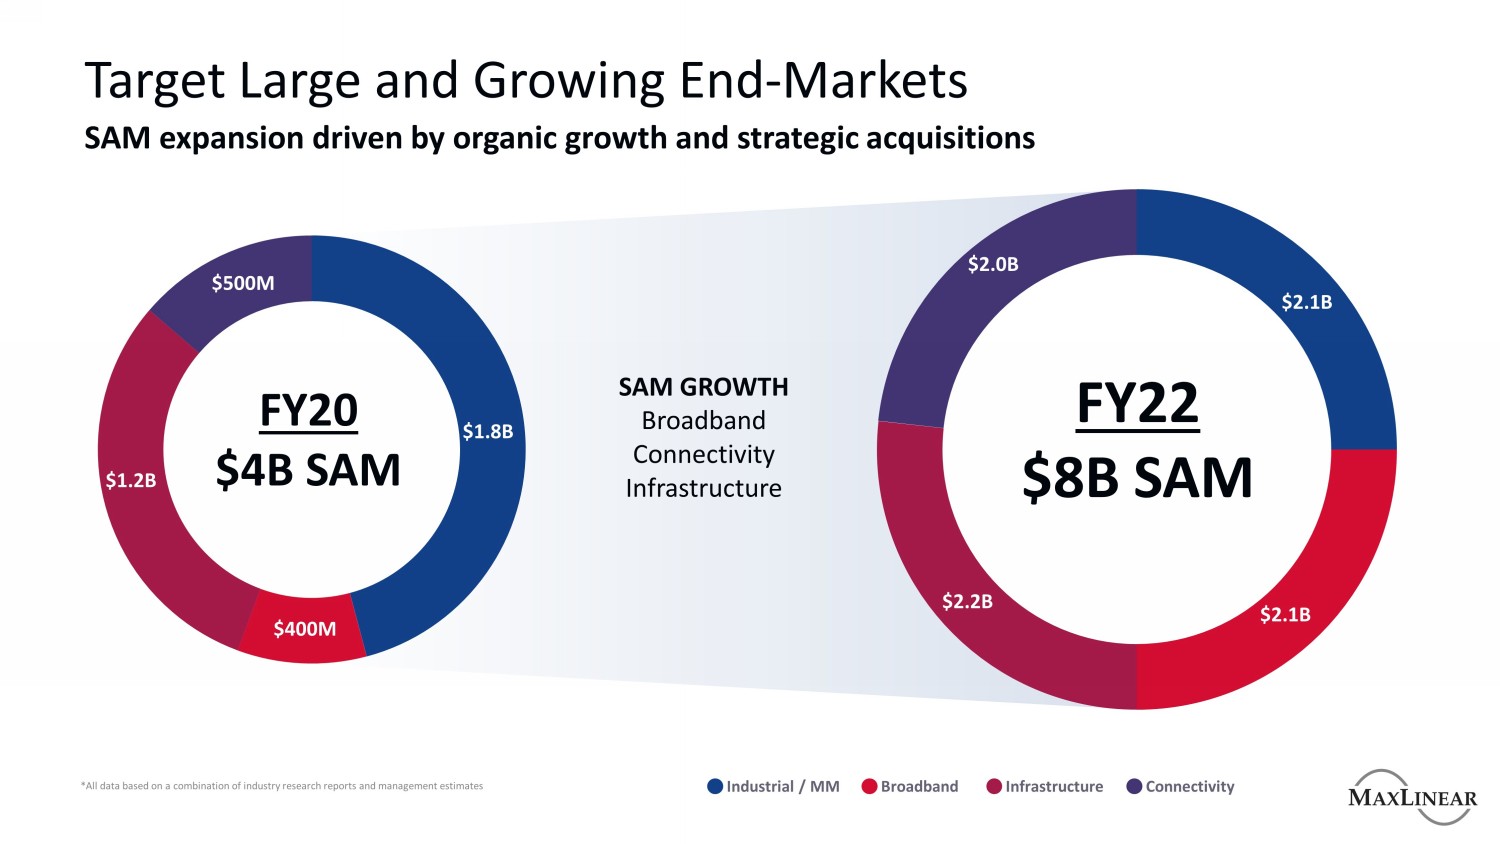
*All data based on a combination of industry research reports and management estimates Target Large and Growing End - Markets SAM expansion driven by organic growth and strategic acquisitions SAM GROWTH Broadband Connectivity Infrastructure FY20 $4B SAM $500M $1.8B $1.2B $400M FY22 $8B SAM $2.2B $2.0B $2.1B $2.1B Industrial / MM Broadband Infrastructure Connectivity
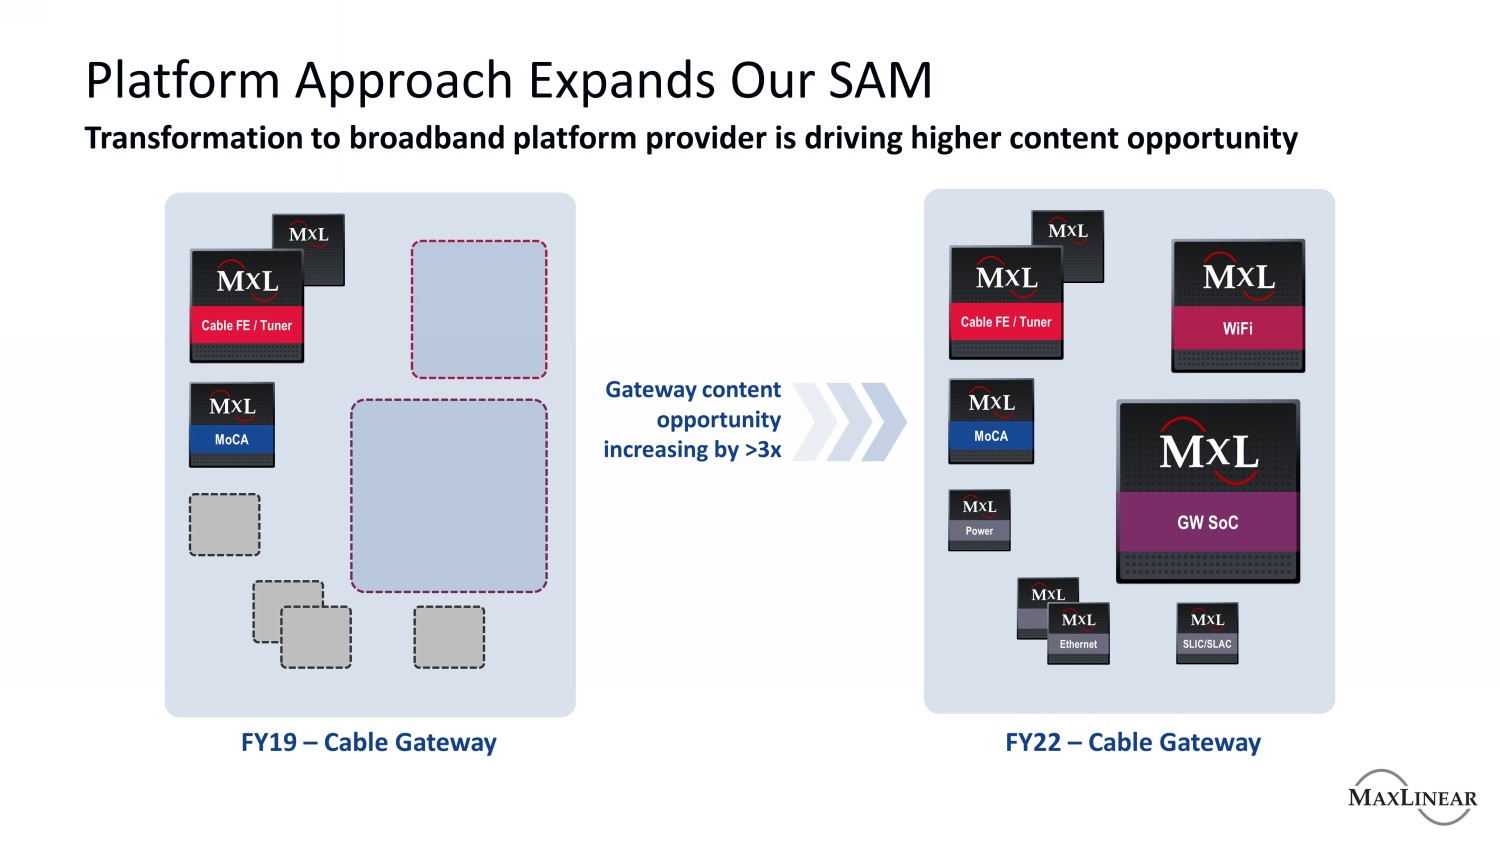
Platform Approach Expands Our SAM Transformation to broadband platform provider is driving higher content opportunity FY19 – Cable Gateway FY22 – Cable Gateway Cable FE / Tuner MoCA Cable FE / Tuner MoCA WiFi GW SoC Power Ethernet SLIC/SLAC Gateway content opportunity increasing by >3x
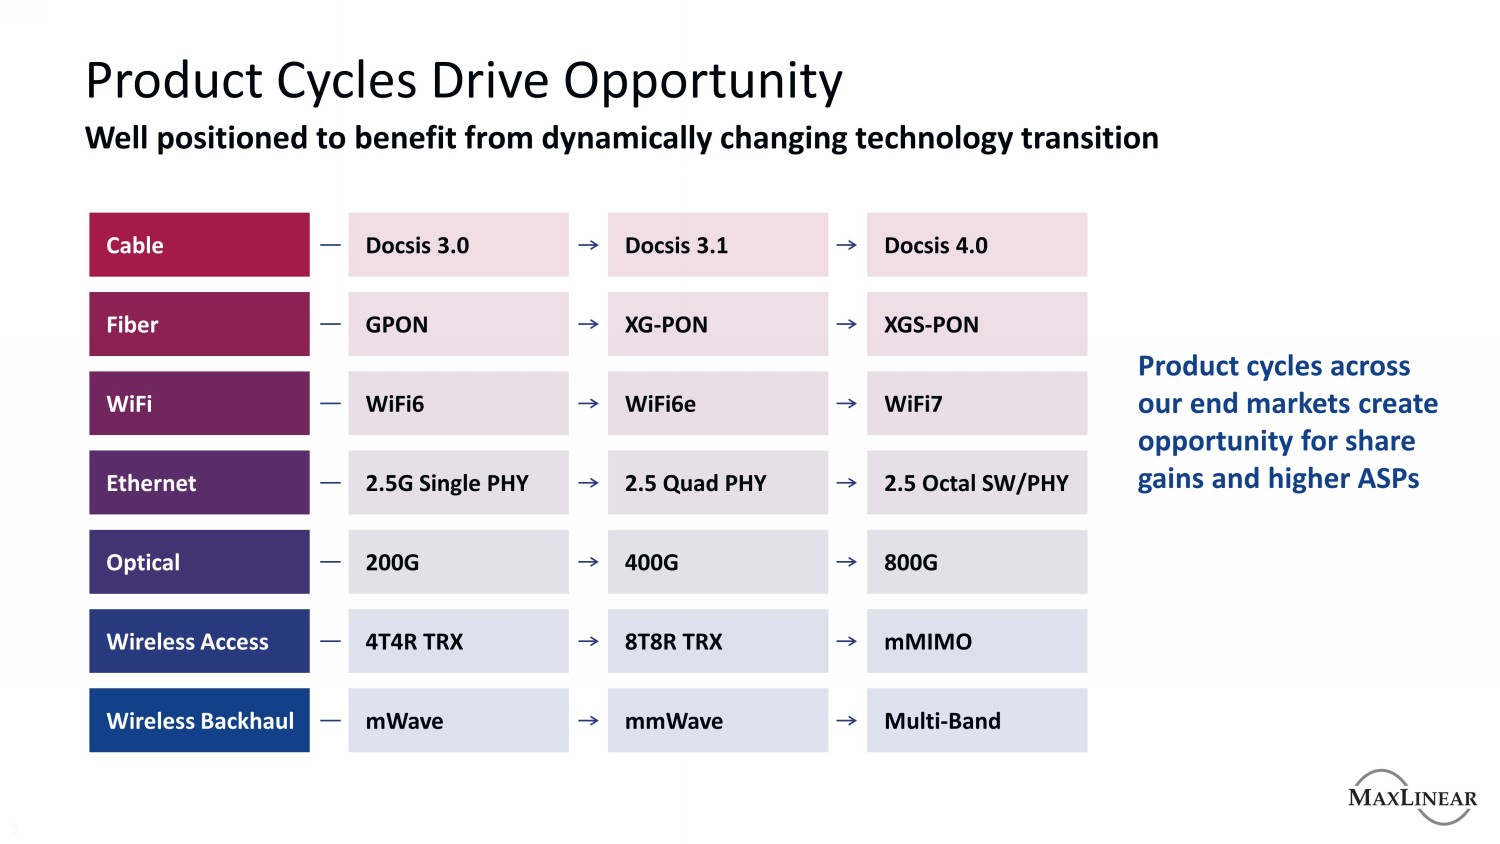
Product Cycles Drive Opportunity 9 Well positioned to benefit from dynamically changing technology transition Product cycles across our end markets create opportunity for share gains and higher ASPs Wireless Backhaul Wireless Access Optical Ethernet WiFi Fiber Cable mWave 4T4R TRX 200G 2.5G Single PHY WiFi6 GPON Docsis 3.0 mmWave 8T8R TRX 400G 2.5 Quad PHY WiFi6e XG - PON Docsis 3.1 Multi - Band mMIMO 800G 2.5 Octal SW/PHY WiFi7 XGS - PON Docsis 4.0
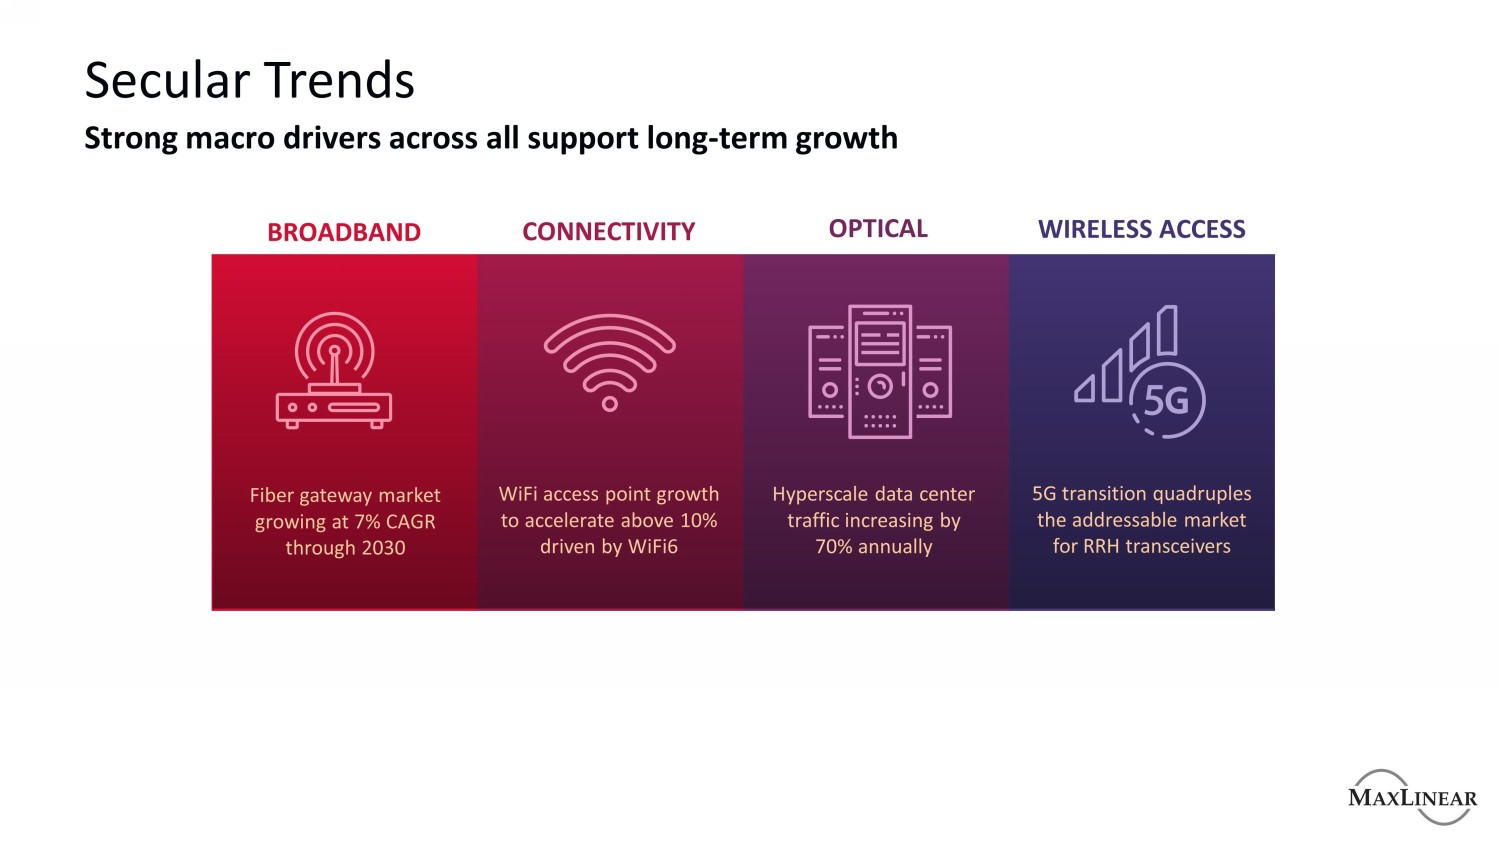
Secular Trends Strong macro drivers across all support long - term growth BROADBAND CONNECTIVITY OPTICAL WIRELESS ACCESS Fiber gateway market growing at 7% CAGR through 2030 WiFi access point growth to accelerate above 10% driven by WiFi6 Hyperscale data center traffic increasing by 70% annually 5G transition quadruples the addressable market for RRH transceivers
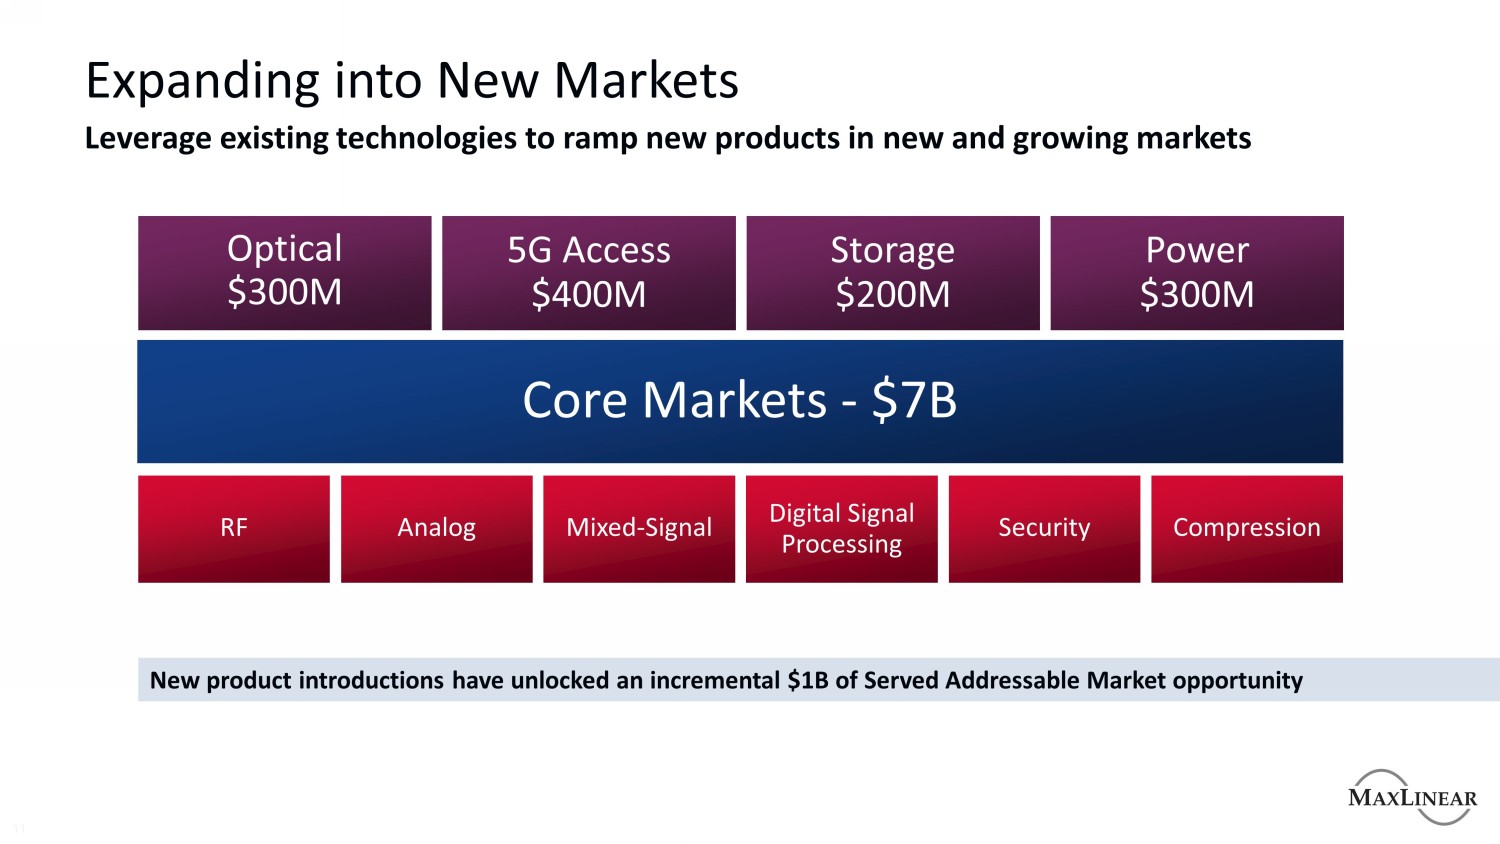
Expanding into New Markets 11 Leverage existing technologies to ramp new products in new and growing markets RF Analog Mixed - Signal Digital Signal Processing Security Compression Optical $300M 5G Access $400M Storage $200M Power $300M Core Markets - $7B New product introductions have unlocked an incremental $1B of Served Addressable Market opportunity
Growth Strategy Increase Market Share & Content per Platform
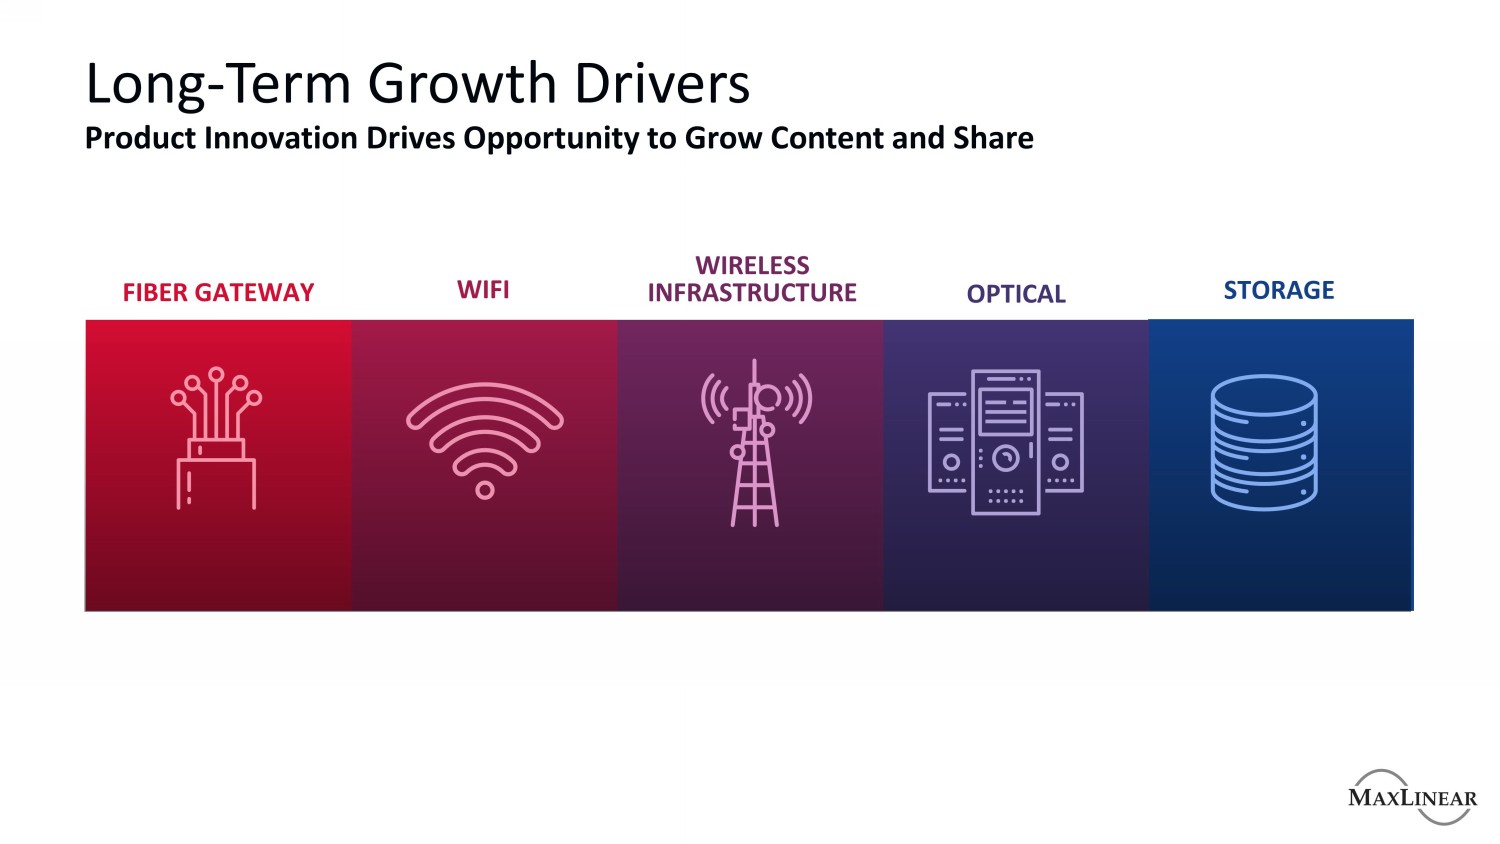
Long - Term Growth Drivers Product Innovation Drives Opportunity to Grow Content and Share FIBER GATEWAY WIFI WIRELESS INFRASTRUCTURE OPTICAL STORAGE
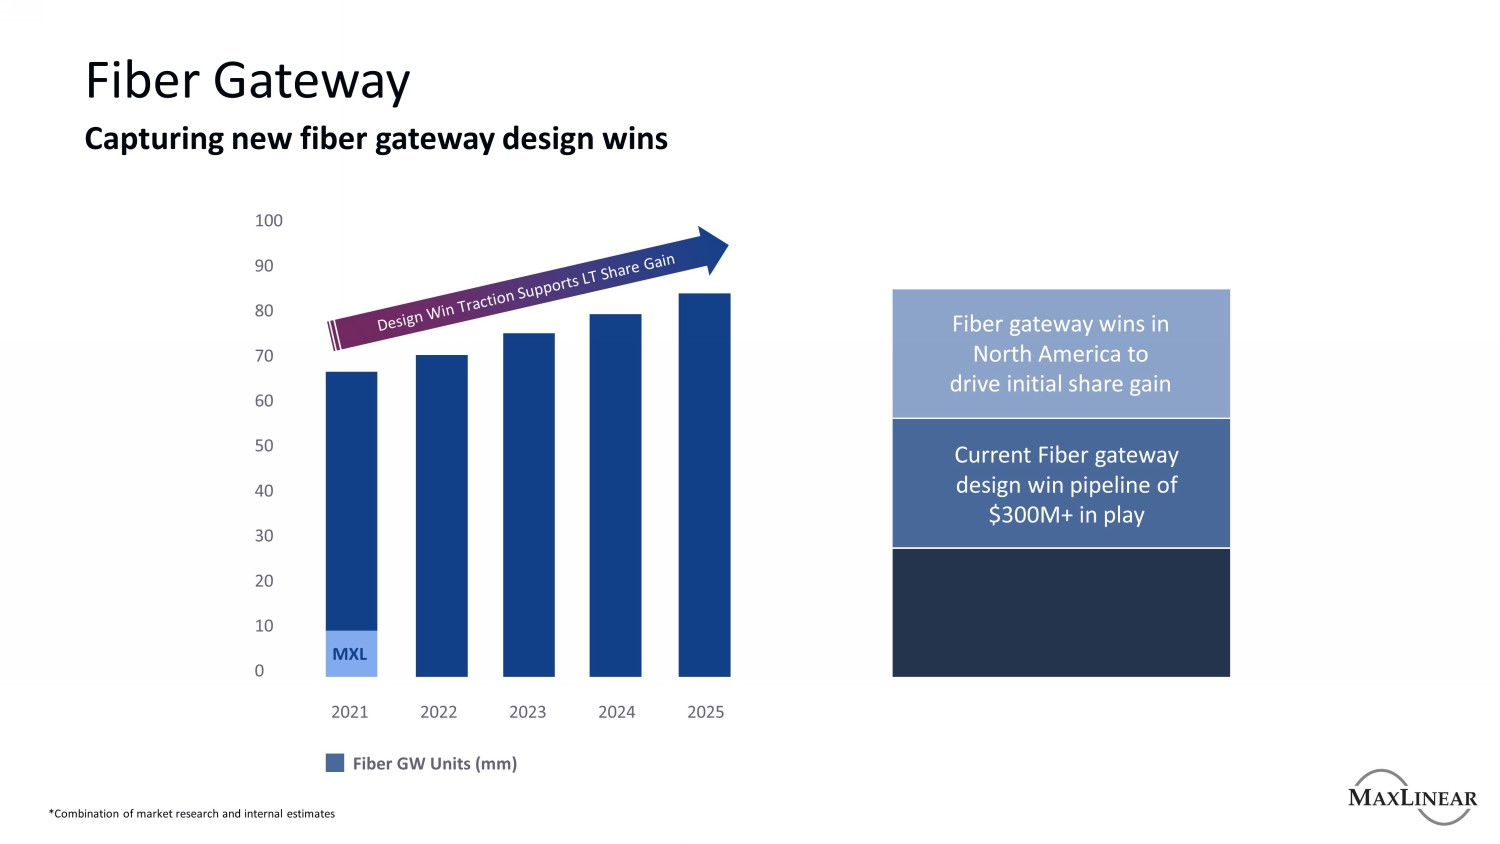
Fiber Gateway Capturing new fiber gateway design wins 2022 2023 2024 2025 2021 MXL 100 90 80 70 60 50 40 30 20 10 0 Fiber GW Units (mm) Fiber gateway wins in North America to drive initial share gain Current Fiber gateway design win pipeline of $300M+ in play *Combination of market research and internal estimates
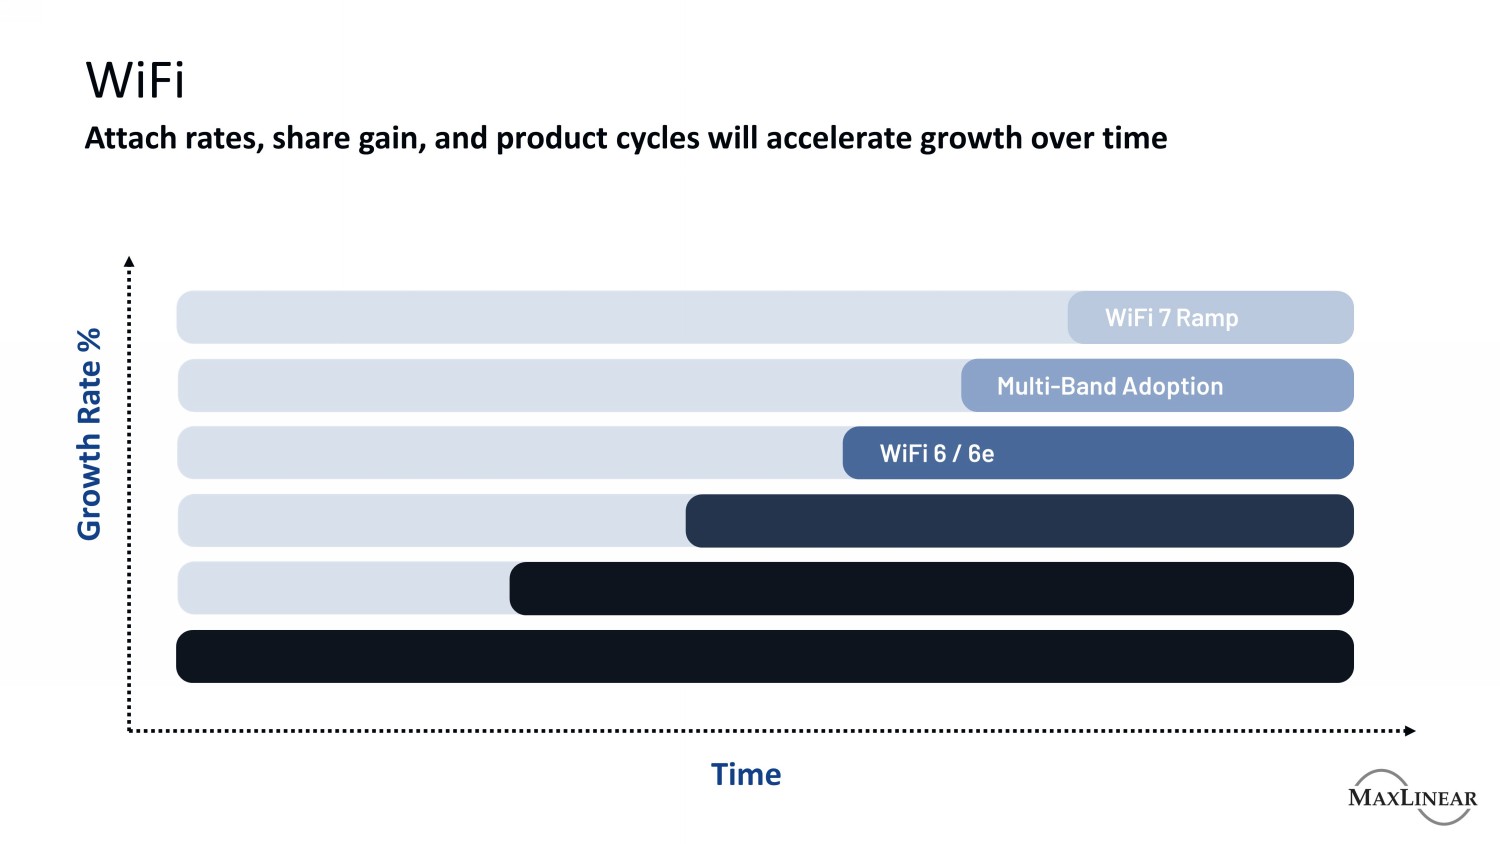
WiFi Attach rates, share gain, and product cycles will accelerate growth over time Growth Rate % Time WiFi 7 Ramp Multi - Band Adoption WiFi 6 / 6e
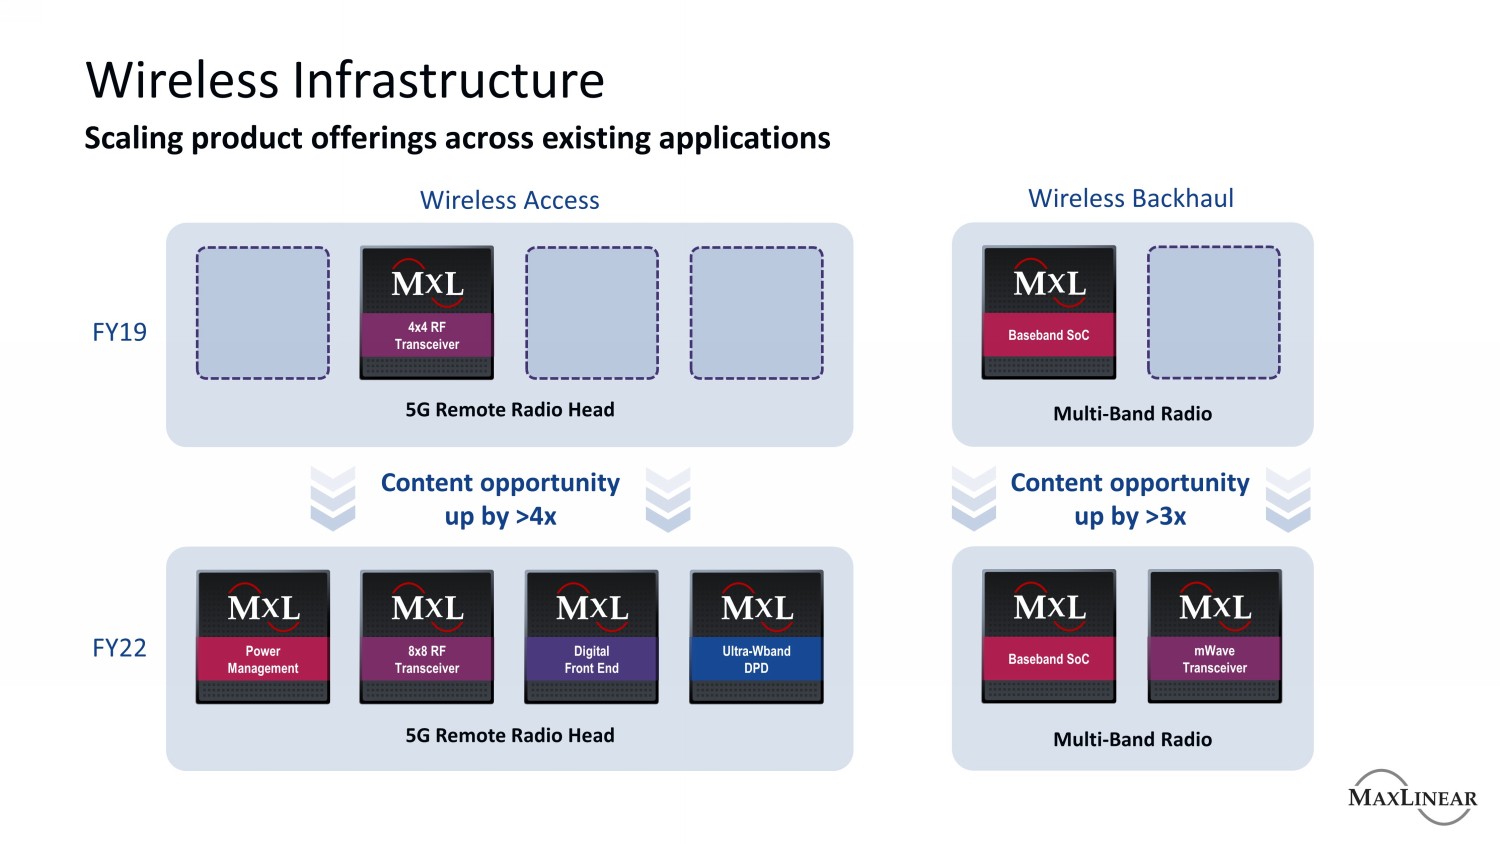
Wireless Infrastructure Scaling product offerings across existing applications Wireless Access Wireless Backhaul FY19 FY22 Content opportunity up by >4x Content opportunity up by >3x 4x4 RF Transceiver Baseband SoC 8x8 RF Transceiver Baseband SoC Power Management Ultra - Wband DPD Digital Front End mWave Transceiver 5G Remote Radio Head 5G Remote Radio Head Multi - Band Radio Multi - Band Radio
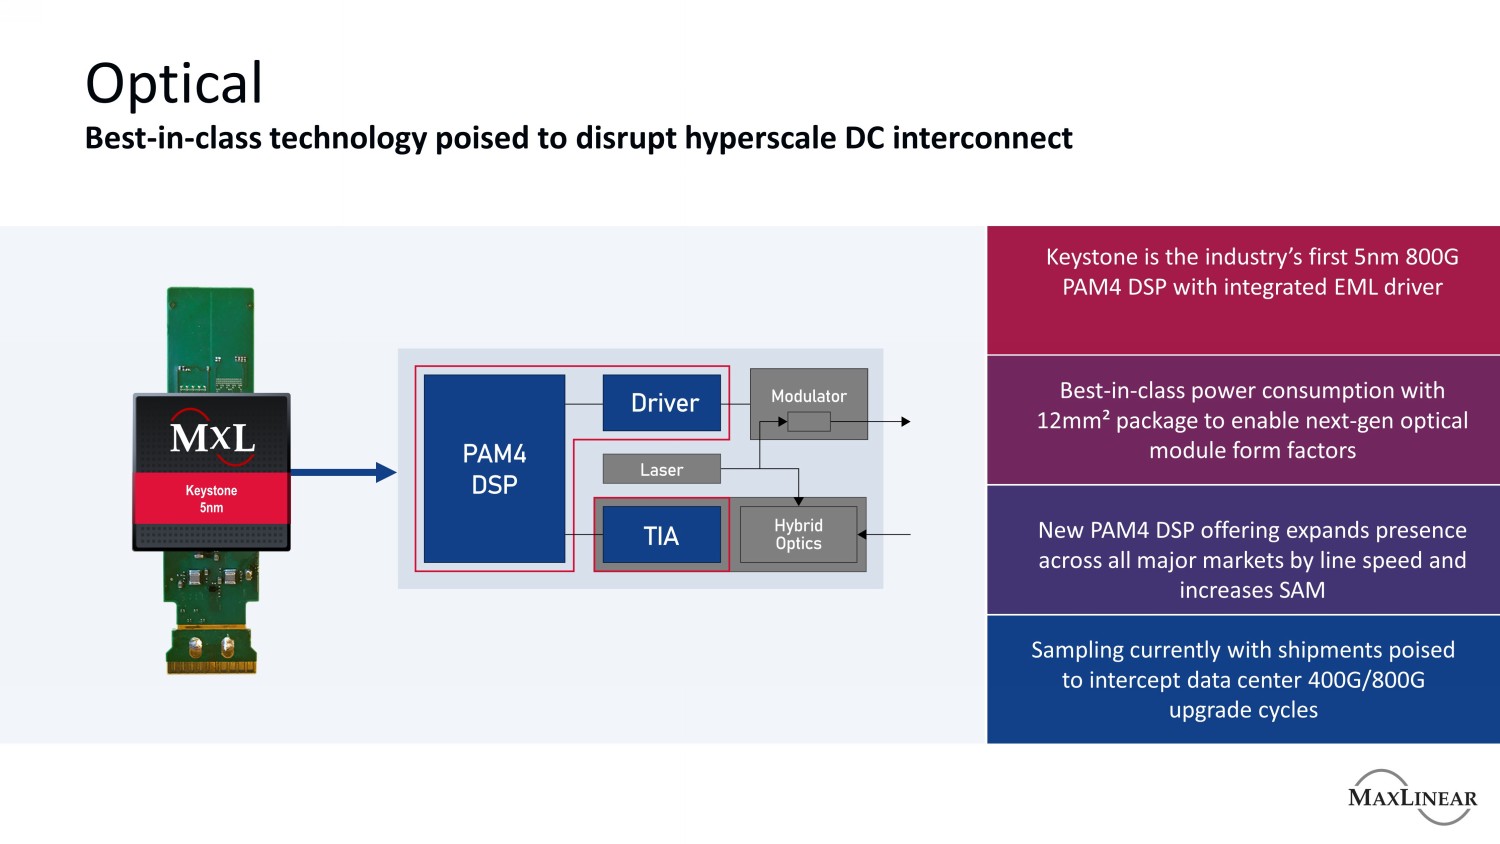
Optical Best - in - class technology poised to disrupt hyperscale DC interconnect Keystone is the industry’s first 5nm 800G PAM4 DSP with integrated EML driver Best - in - class power consumption with 12mm² package to enable next - gen optical module form factors New PAM4 DSP offering expands presence across all major markets by line speed and increases SAM Keystone 5nm Sampling currently with shipments poised to intercept data center 400G/800G upgrade cycles
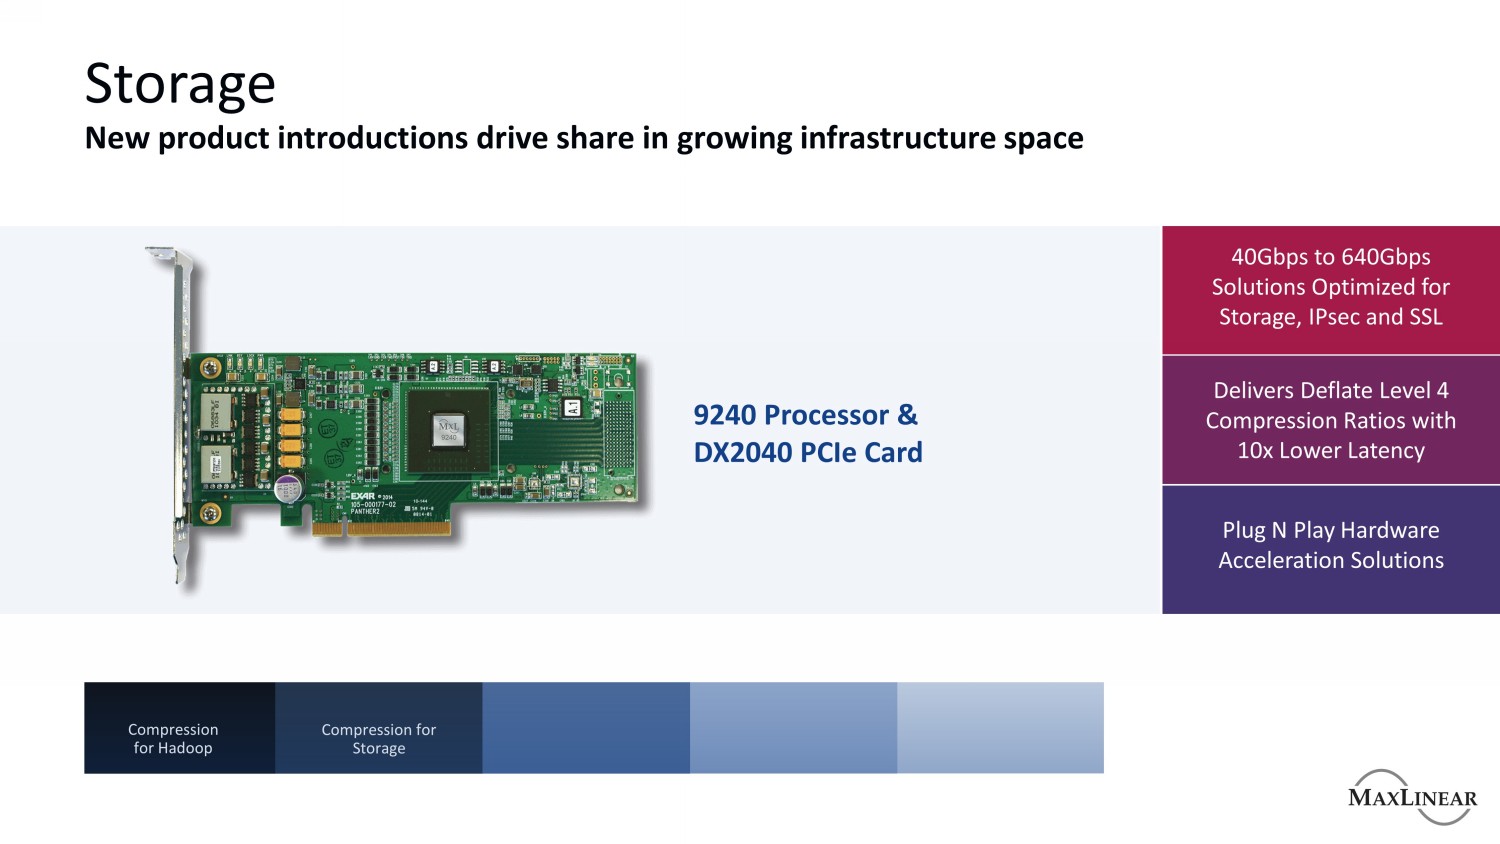
Storage New product introductions drive share in growing infrastructure space Compression for Hadoop Compression for Storage 40Gbps to 640Gbps Solutions Optimized for Storage, IPsec and SSL Delivers Deflate Level 4 Compression Ratios with 10x Lower Latency Plug N Play Hardware Acceleration Solutions 9240 Processor & DX2040 PCIe Card

Financial Strategy Drive operating leverage and shareholder returns
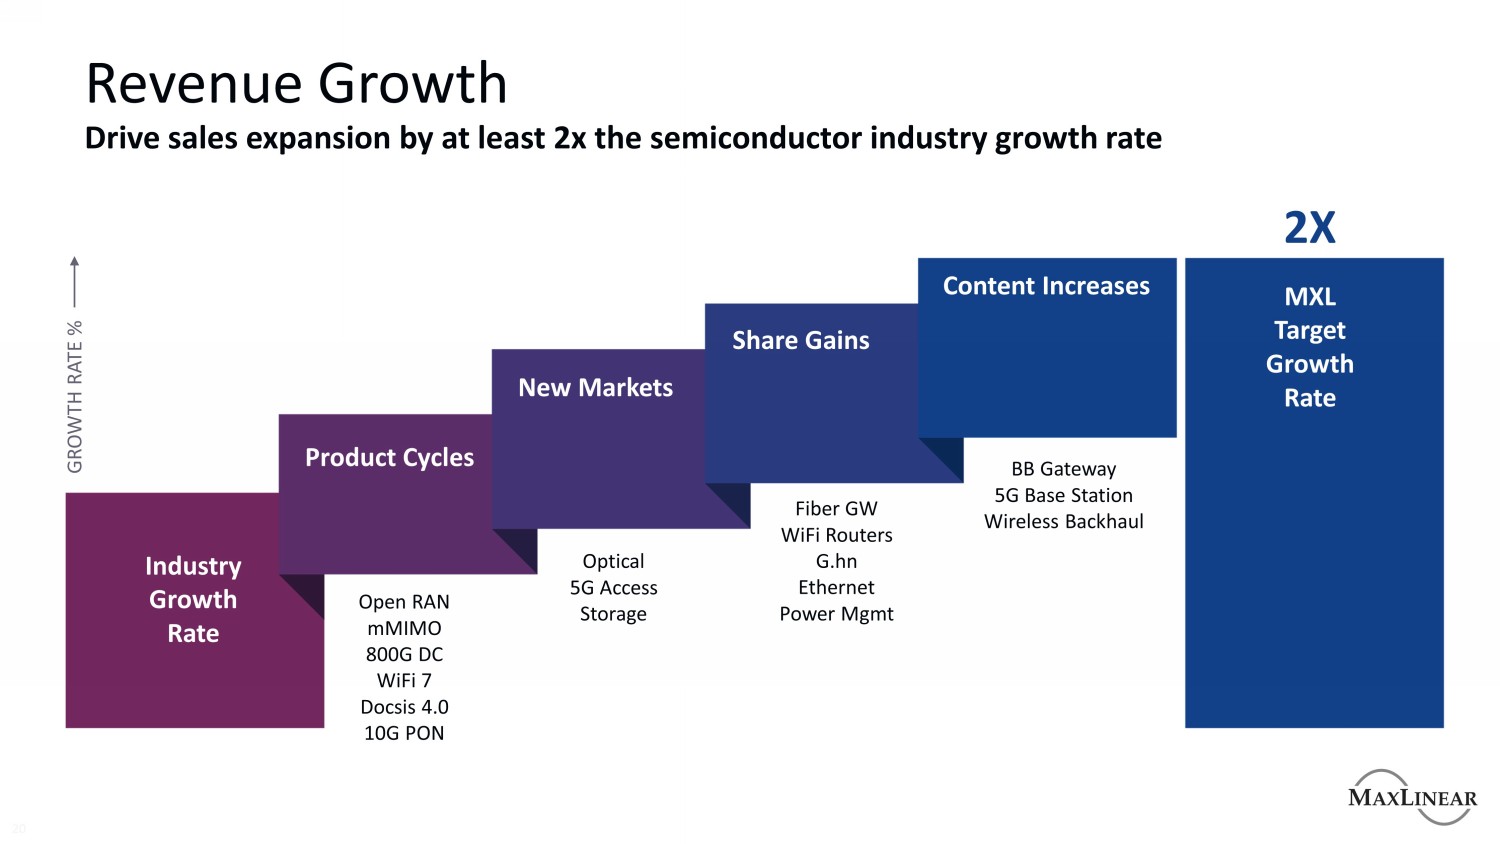
Revenue Growth 20 Drive sales expansion by at least 2x the semiconductor industry growth rate Industry Growth Rate MXL Target Growth Rate Product Cycles Content Increases New Markets Share Gains Fiber GW WiFi Routers G.hn Ethernet Power Mgmt BB Gateway 5G Base Station Wireless Backhaul Optical 5G Access Storage Open RAN mMIMO 800G DC WiFi 7 Docsis 4.0 10G PON 2X GROWTH RATE %
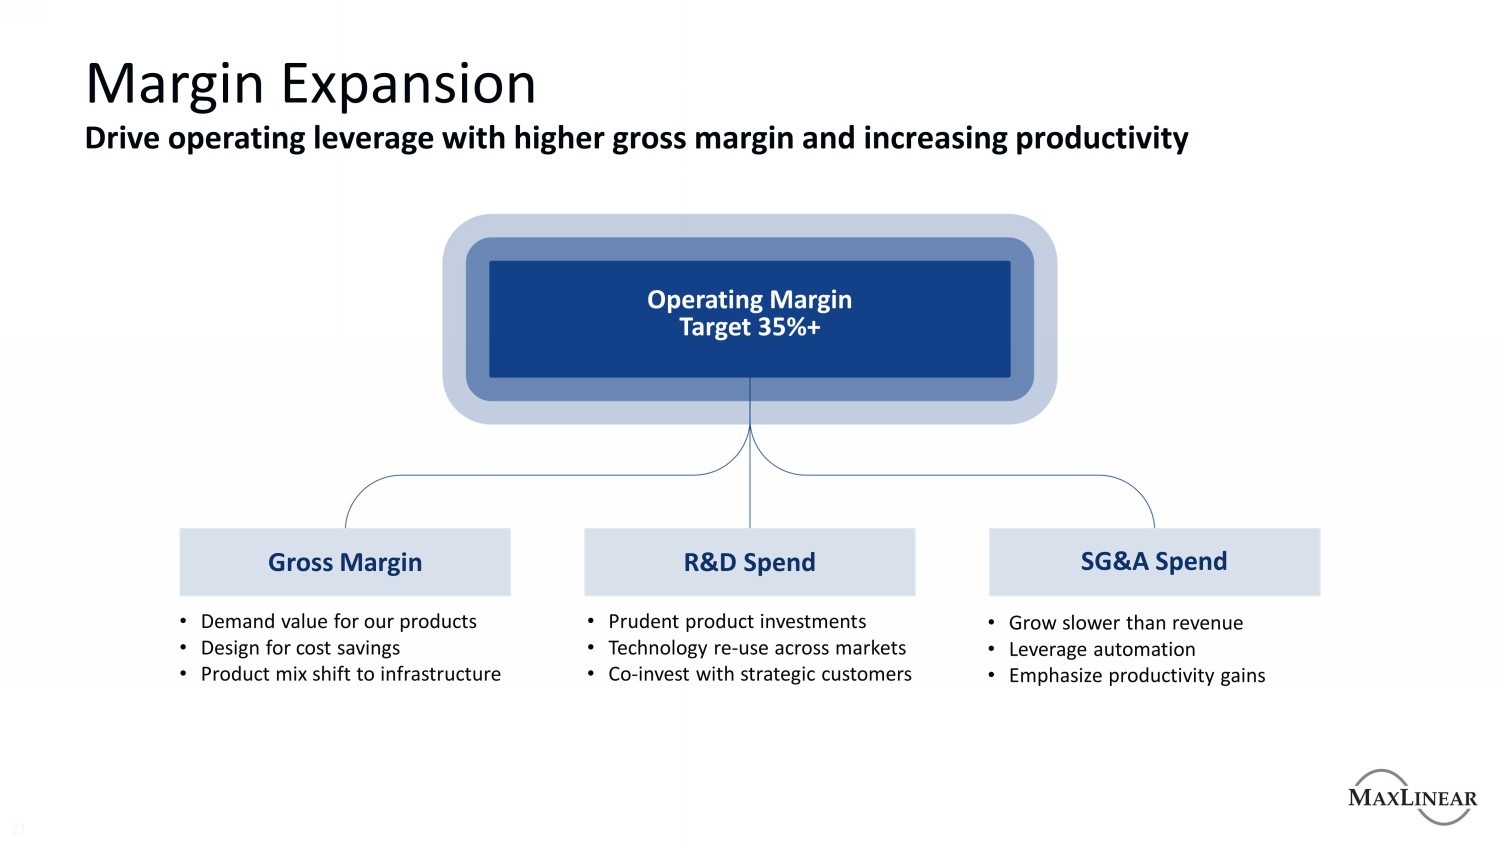
Margin Expansion 21 Drive operating leverage with higher gross margin and increasing productivity • Grow slower than revenue • Leverage automation • Emphasize productivity gains • Prudent product investments • Technology re - use across markets • Co - invest with strategic customers • Demand value for our products • Design for cost savings • Product mix shift to infrastructure Gross Margin Operating Margin Target 35%+ R&D Spend SG&A Spend
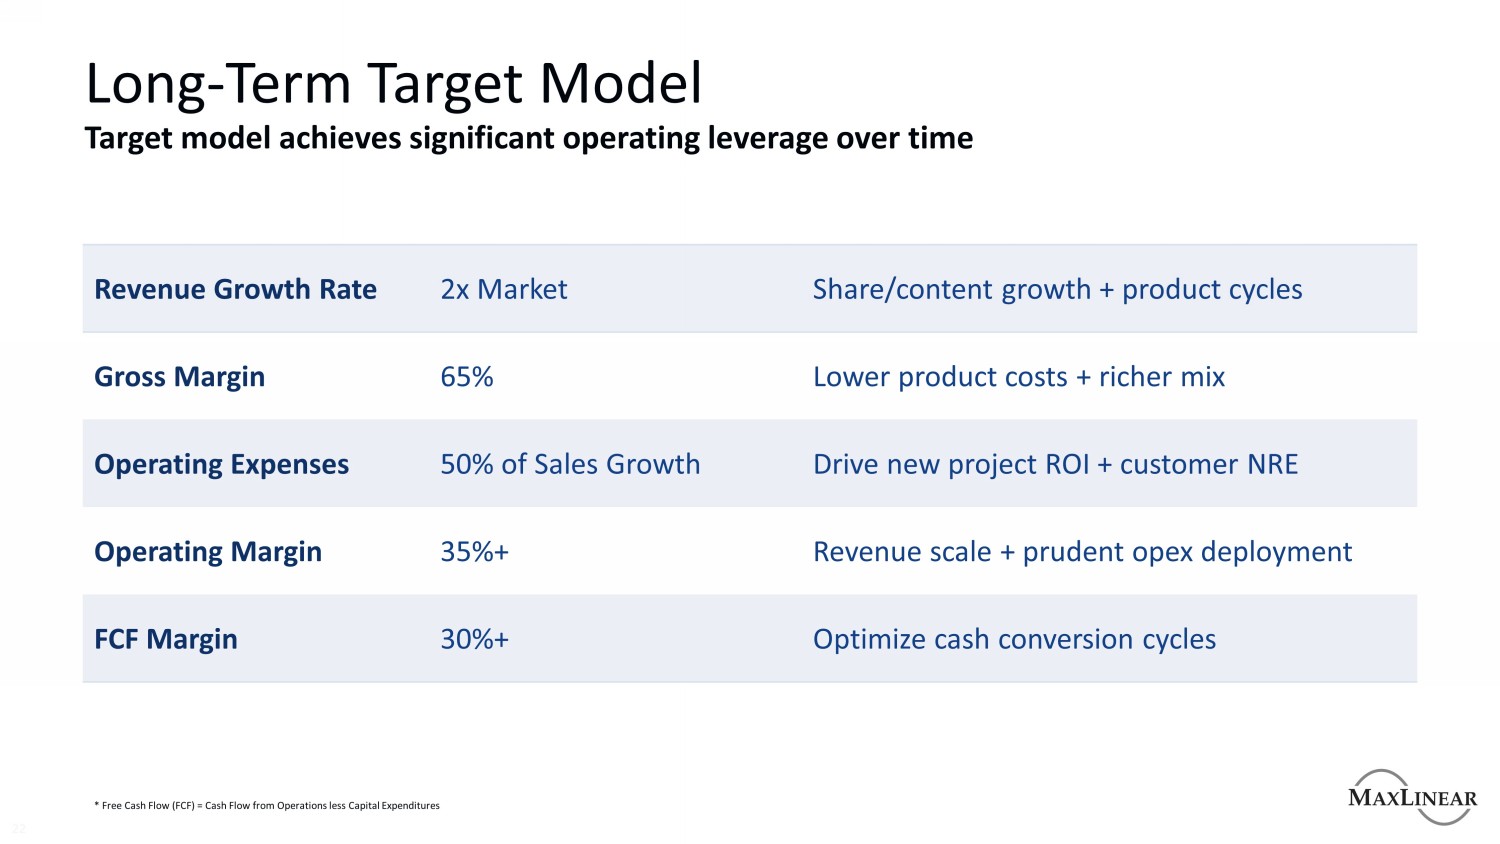
Long - Term Target Model 22 Target model achieves significant operating leverage over time Revenue Growth Rate 2x Market Share/content growth + product cycles Gross Margin 65% Lower product costs + richer mix Operating Expenses 50% of Sales Growth Drive new project ROI + customer NRE Operating Margin 35%+ Revenue scale + prudent opex deployment FCF Margin 30%+ Optimize cash conversion cycles * Free Cash Flow (FCF) = Cash Flow from Operations less Capital Expenditures
MaxLinear to Acquire Silicon Motion Building Transformative Scale
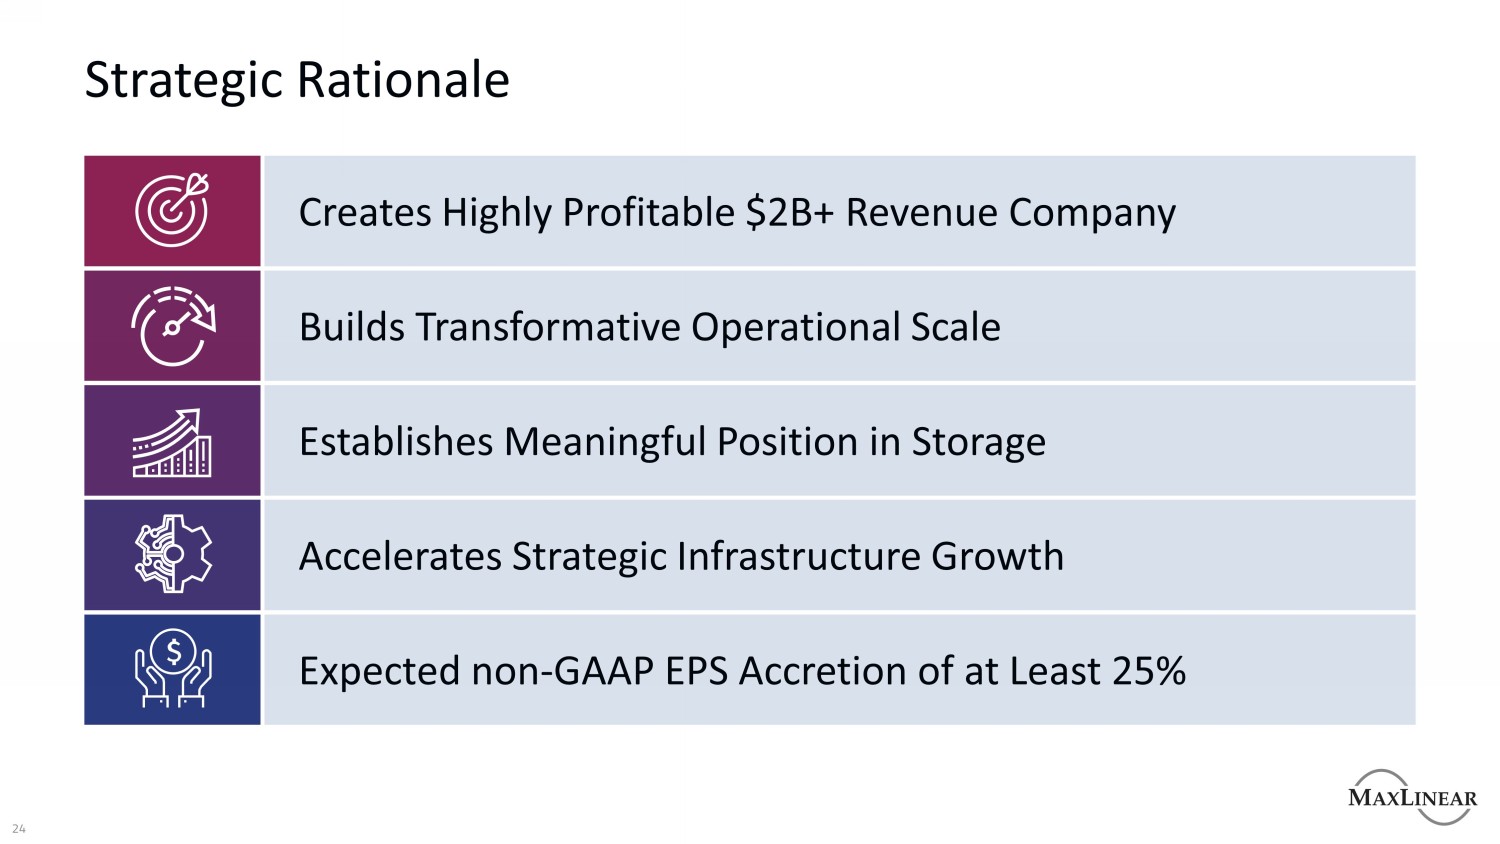
24 Strategic Rationale Accelerates Strategic Infrastructure Growth Establishes Meaningful Position in Storage Builds Transformative Operational Scale Creates Highly Profitable $2B+ Revenue Company Expected non - GAAP EPS Accretion of at Least 25%
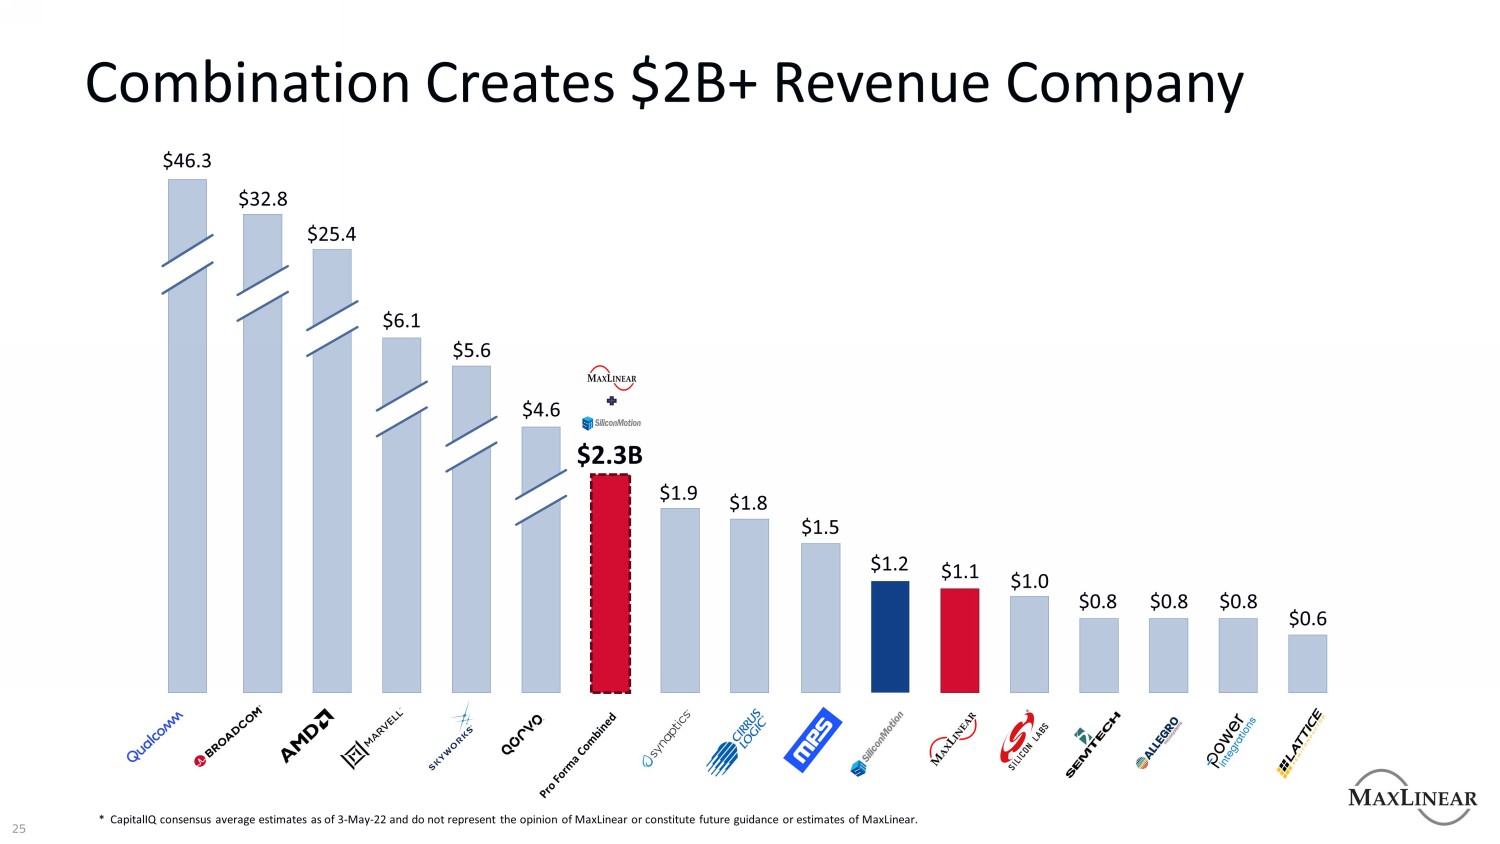
2 5 Combination Creates $2B+ Revenue Company and do not represent the opinion of MaxLinear or constitute future guidance or estimates of MaxLinear
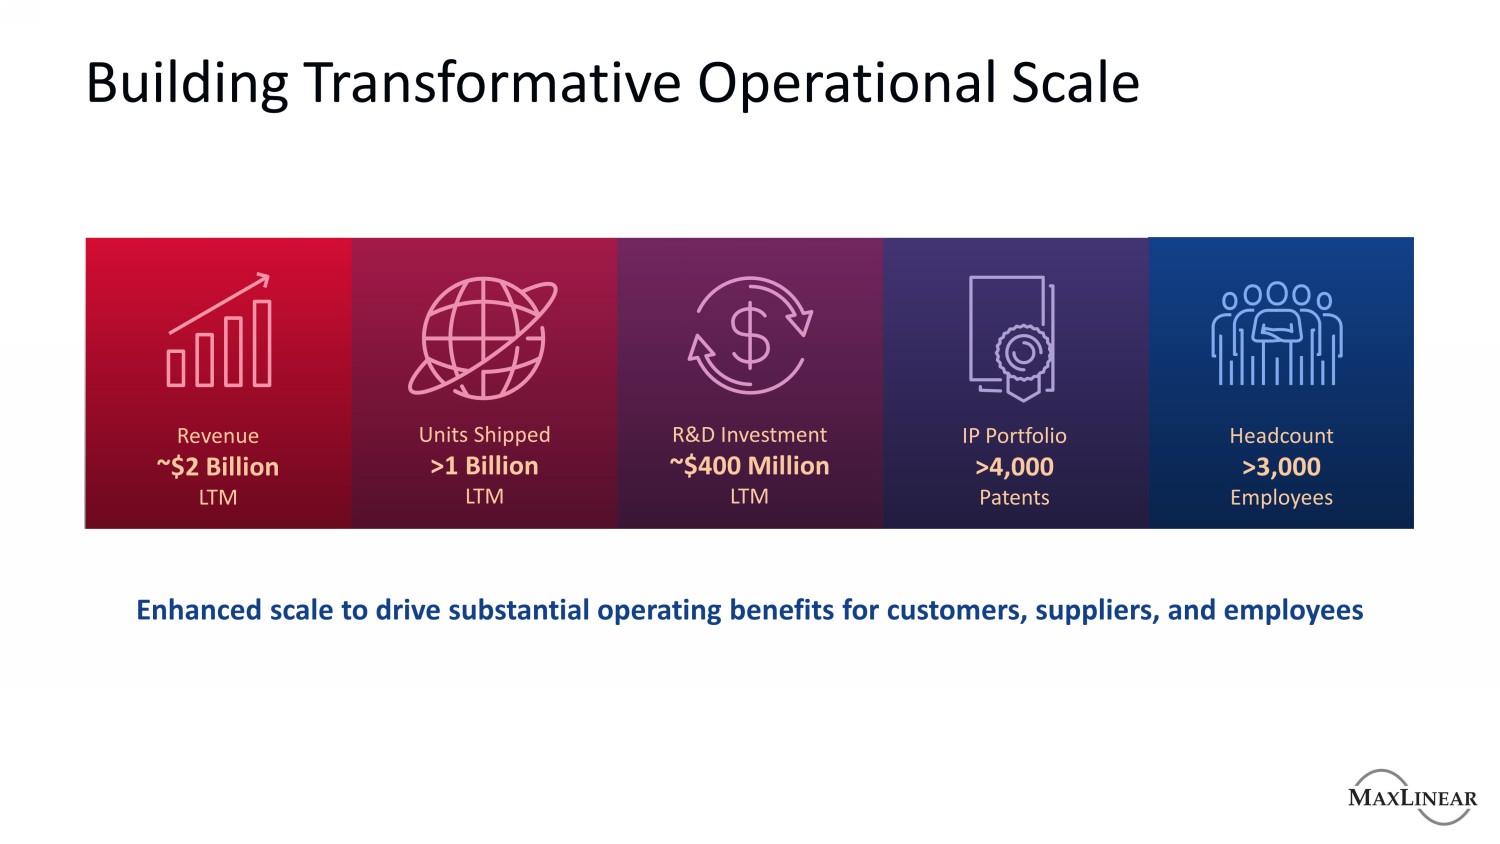
Building Transformative Operational Scale Headcount >3,000 Employees IP Portfolio >4,000 Patents Units Shipped >1 Billion LTM Revenue ~$2 Billion LTM R&D Investment ~$400 Million LTM Enhanced scale to drive substantial operating benefits for customers, suppliers, and employees
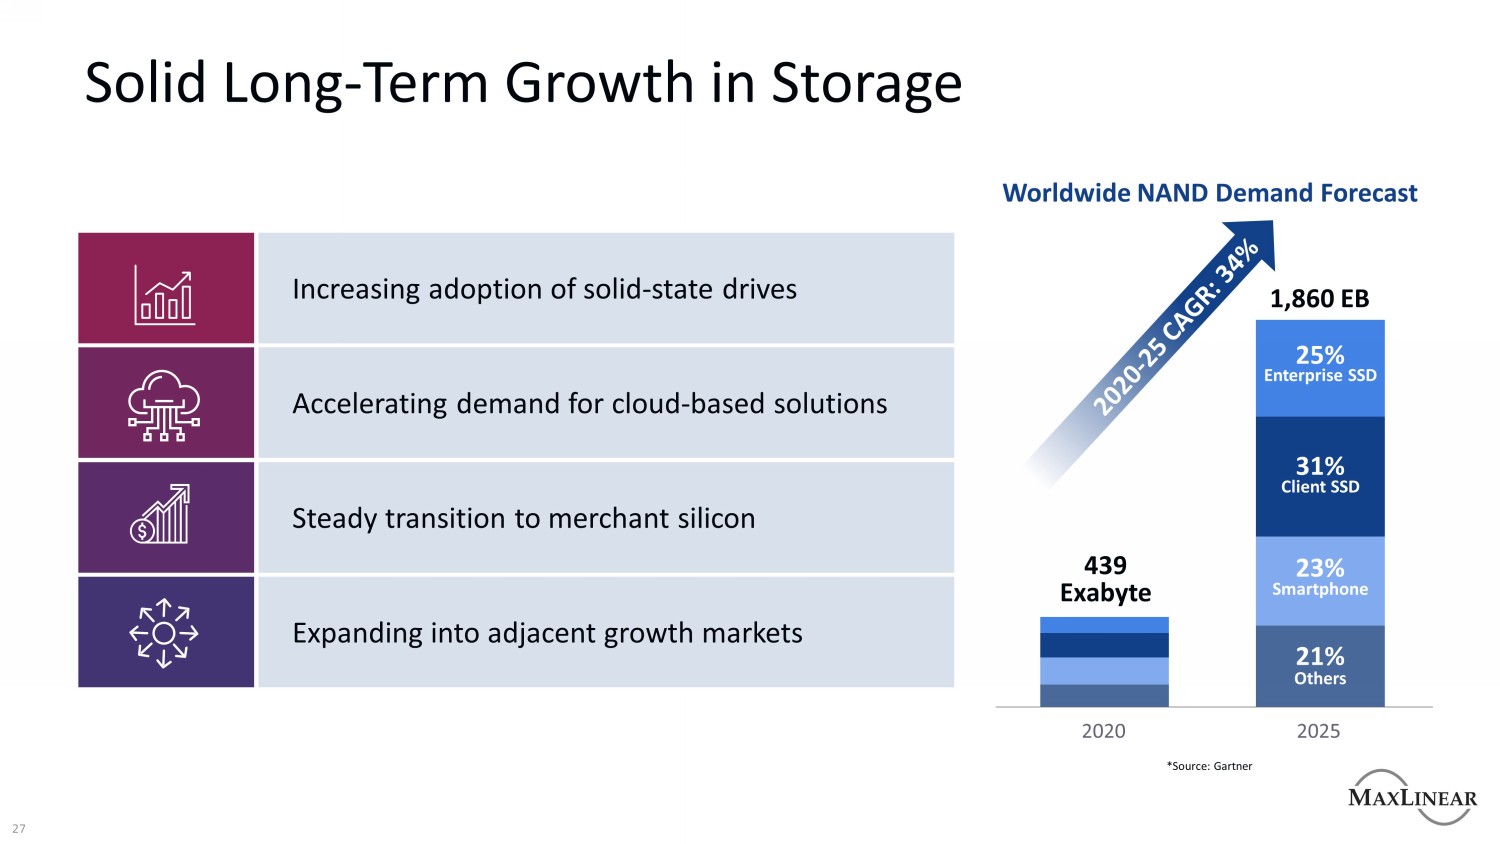
27 Solid Long - Term Growth in Storage 1,860 EB 439 Exabyte 25% 31% 23% 21% Enterprise SSD Client SSD Smartphone Others Worldwide NAND Demand Forecast 2020 2025 Expanding into adjacent growth markets Steady transition to merchant silicon Accelerating demand for cloud - based solutions Increasing adoption of solid - state drives *Source: Gartner
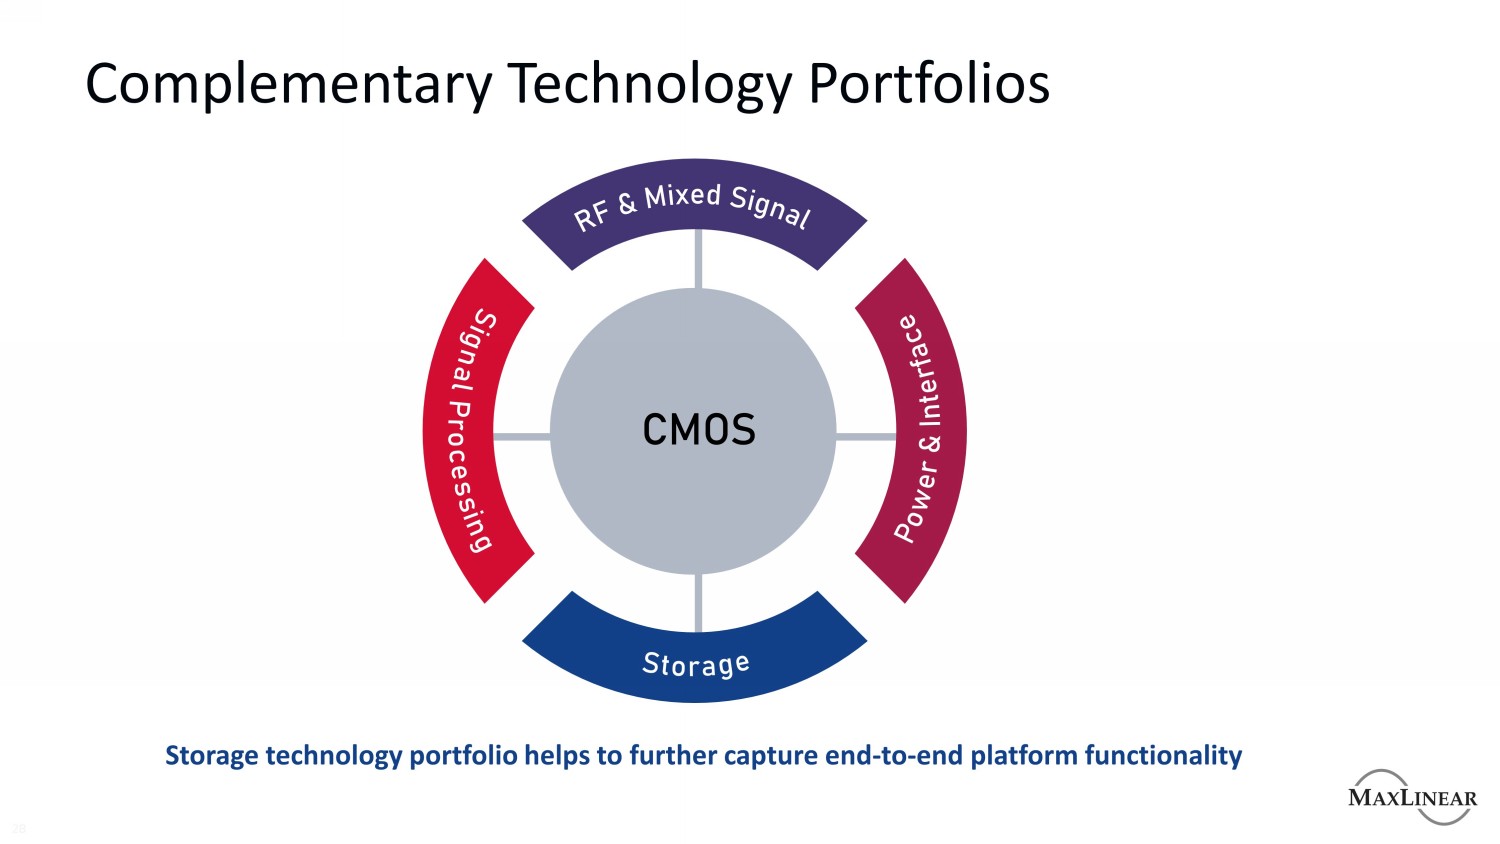
Complementary Technology Portfolios 28 Storage technology portfolio helps to further capture end - to - end platform functionality
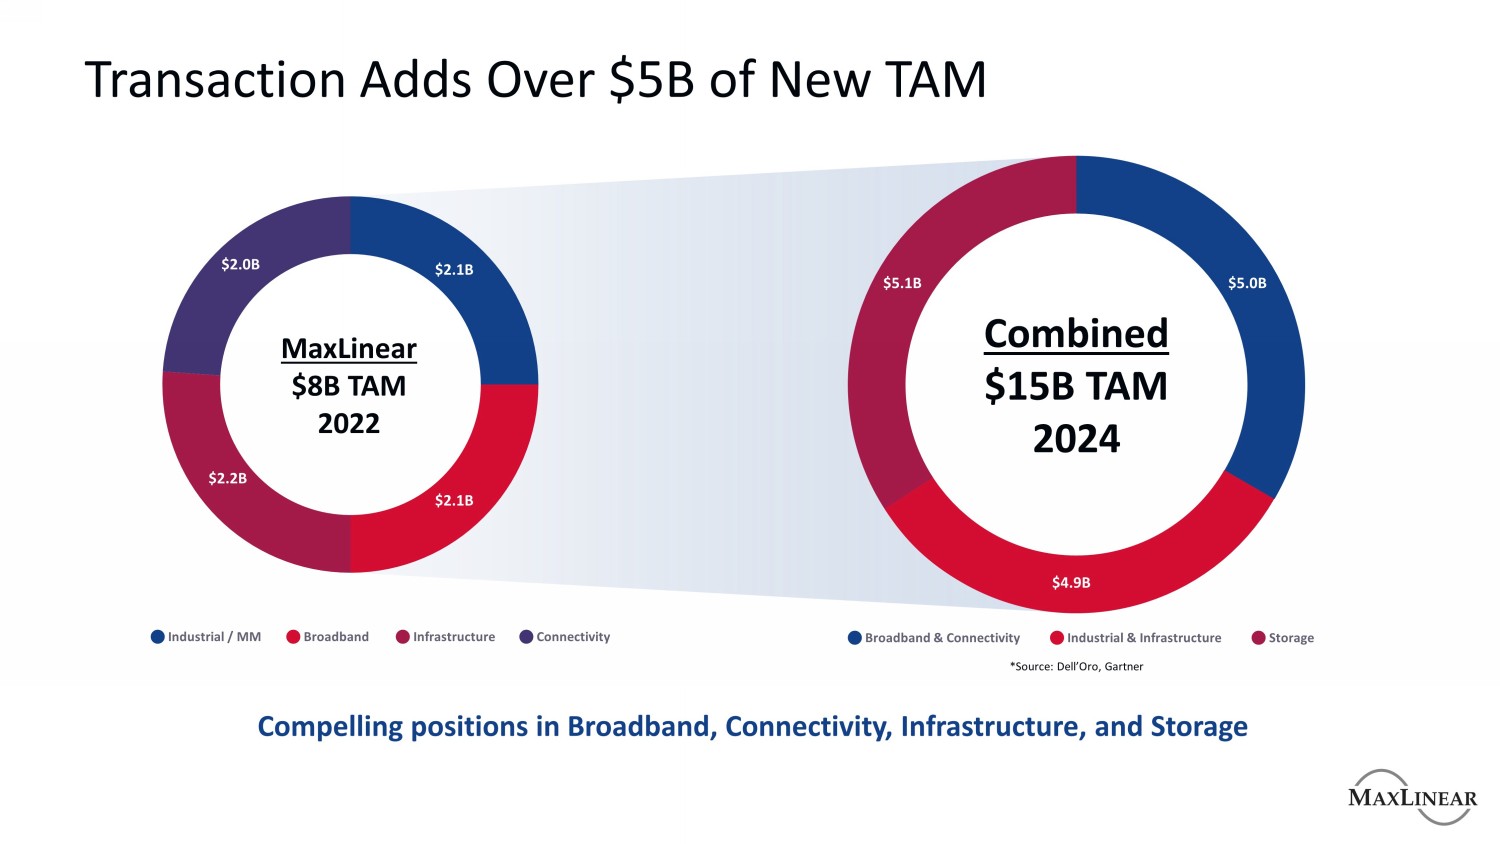
Transaction Adds Over $5B of New TAM MaxLinear $8B TAM 2022 $2.0B $2.1B $2.2B $2.1B Combined $15B TAM 2024 $5.1B $5.0B $4.9B Industrial / MM Broadband Infrastructure Connectivity Broadband & Connectivity Industrial & Infrastructure Storage Compelling positions in Broadband, Connectivity, Infrastructure, and Storage *Source: Dell’Oro, Gartner
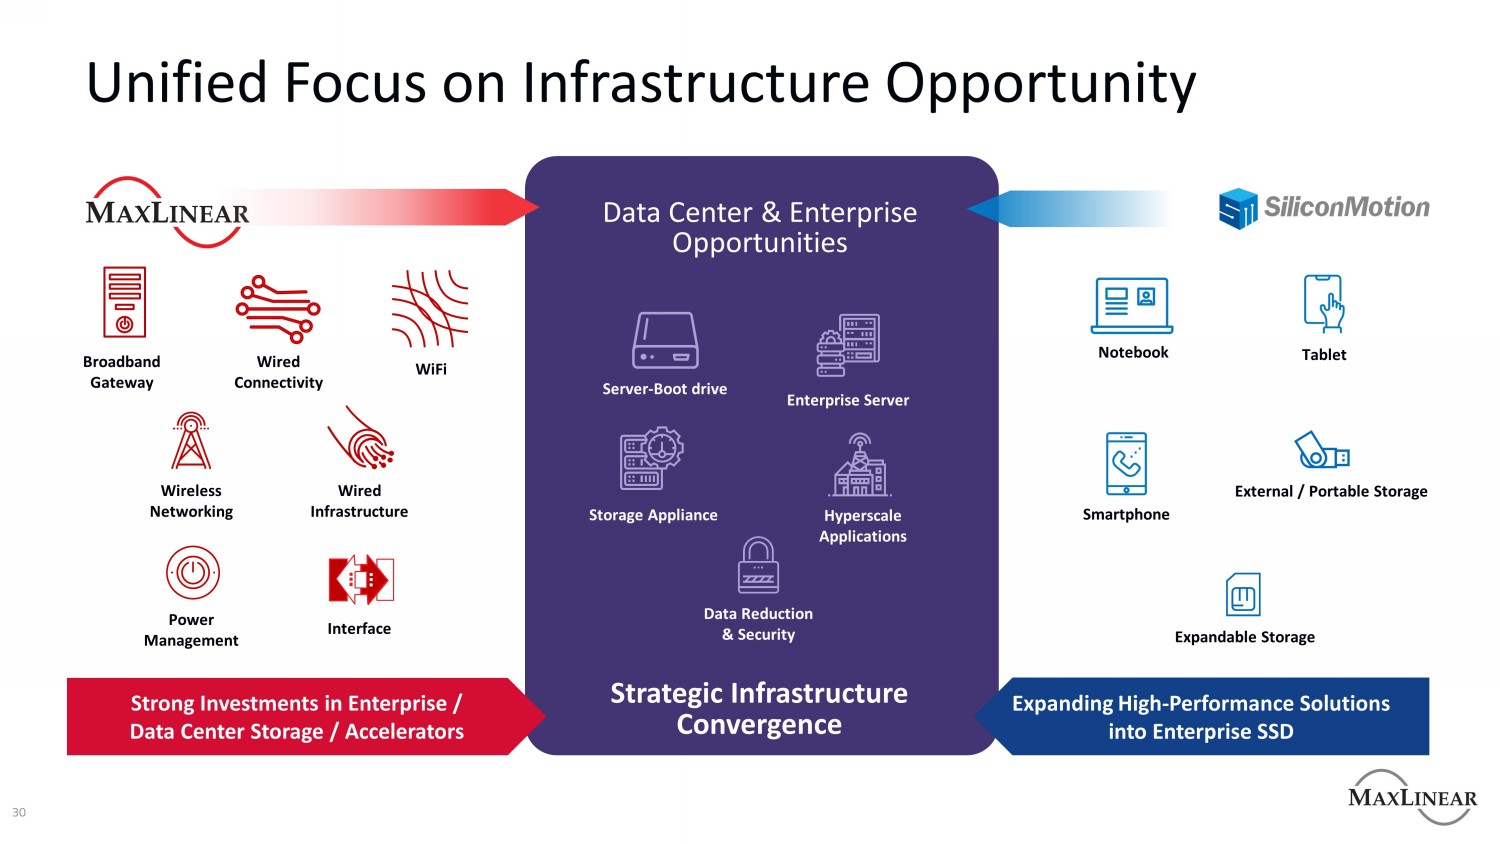
30 Unified Focus on Infrastructure Opportunity Data Center & Enterprise Opportunities Strategic Infrastructure Convergence Server - Boot drive Enterprise Server Storage Appliance Hyperscale Applications Data Reduction & Security Expanding High - Performance Solutions into Enterprise SSD Strong Investments in Enterprise / Data Center Storage / Accelerators
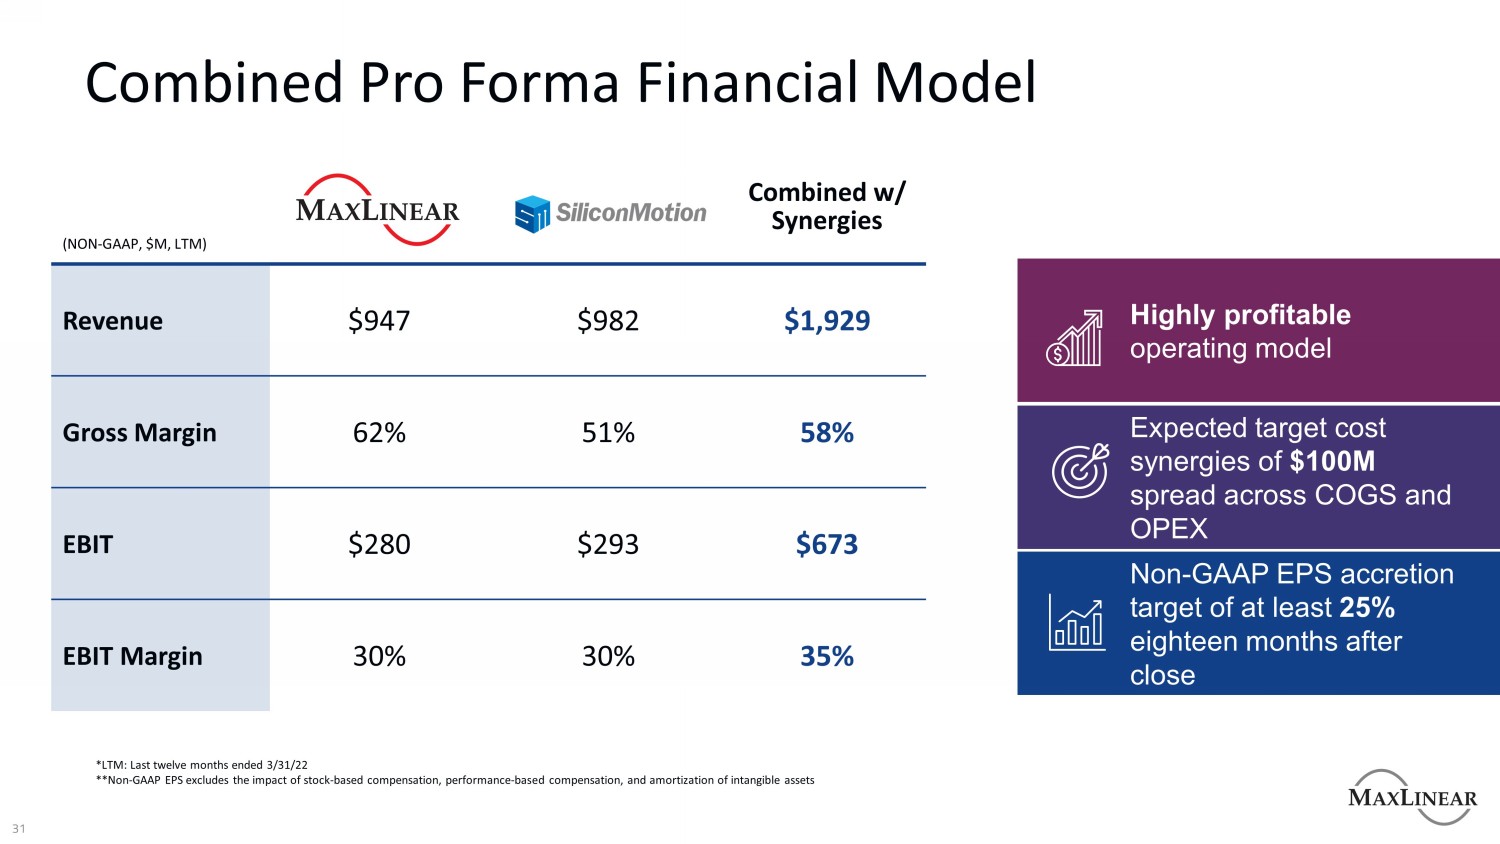
31 Combined Pro Forma Financial Model Combined w/ Synergies Revenue $947 $982 $1,929 Gross Margin 62% 51% 58% EBIT $280 $293 $673 EBIT Margin 30% 30% 35% Highly profitable operating model Expected target cost synergies of $100M spread across COGS and OPEX Non - GAAP EPS accretion target of at least 25% eighteen months after close *LTM: Last twelve months ended 3/31/22 **Non - GAAP EPS excludes the impact of stock - based compensation, performance - based compensation, and amortization of intangible a ssets
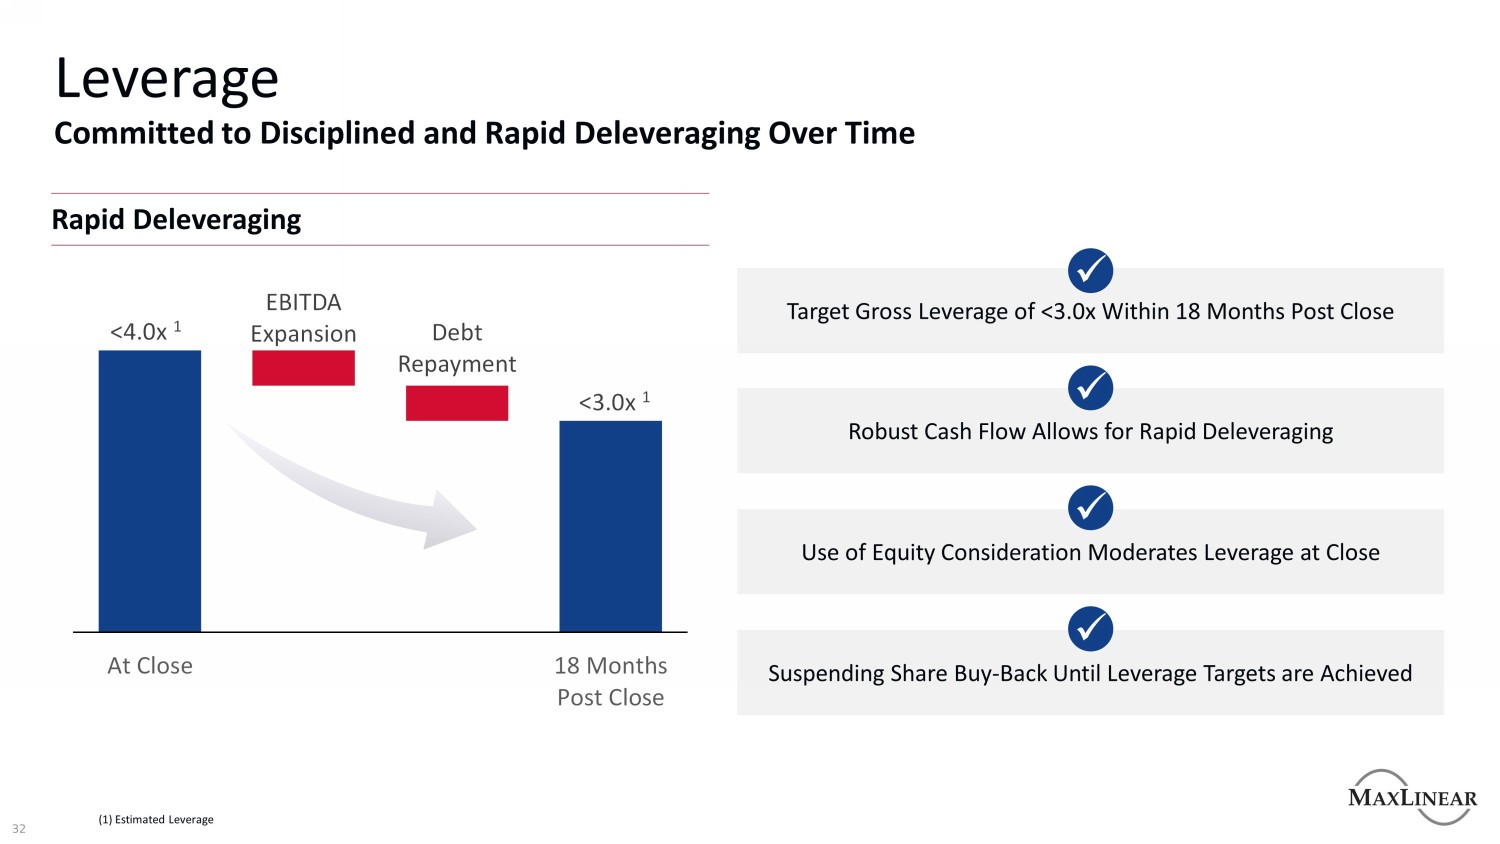
<4.0x 1 <3.0x 1 EBITDA Expansion Debt Repayment At Close 18 Months Post Close Leverage Robust Cash Flow Allows for Rapid Deleveraging x Target Gross Leverage of <3.0x Within 18 Months Post Close x Use of Equity Consideration Moderates Leverage at Close x Committed to Disciplined and Rapid Deleveraging Over Time Rapid Deleveraging Suspending Share Buy - Back Until Leverage Targets are Achieved x (1) Estimated Leverage 32
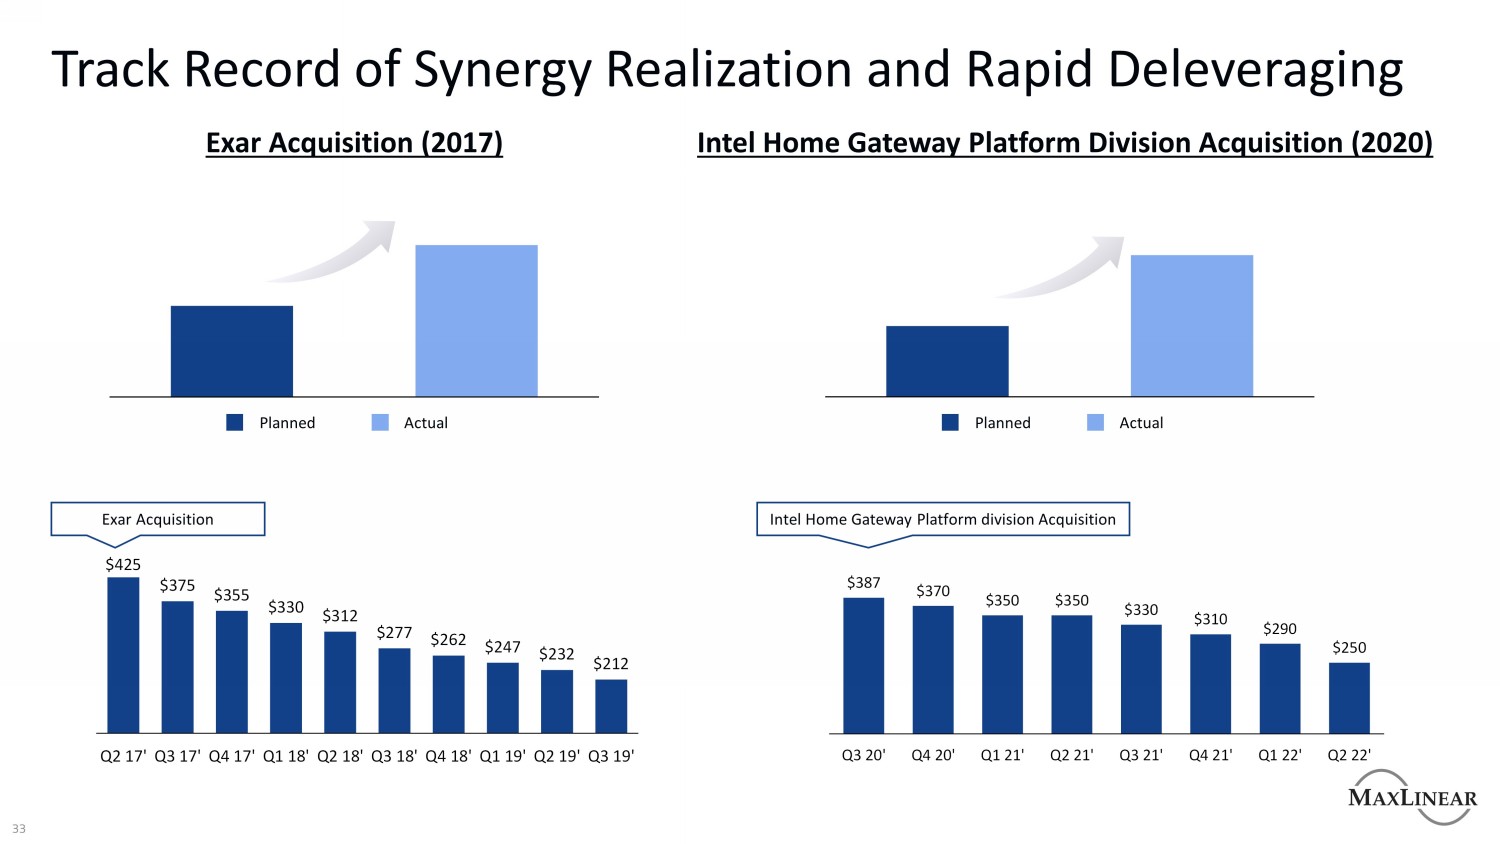
$387 $370 $350 $350 $330 $310 $290 $250 Q3 20' Q4 20' Q1 21' Q2 21' Q3 21' Q4 21' Q1 22' Q2 22' $425 $375 $355 $330 $312 $277 $262 $247 $232 $212 Q2 17' Q3 17' Q4 17' Q1 18' Q2 18' Q3 18' Q4 18' Q1 19' Q2 19' Q3 19' Track Record of Synergy Realization and Rapid Deleveraging Exar Acquisition Intel Home Gateway Platform division Acquisition Exar Acquisition (2017) Intel Home Gateway Platform Division Acquisition (2020) Planned Actual Planned Actual 33
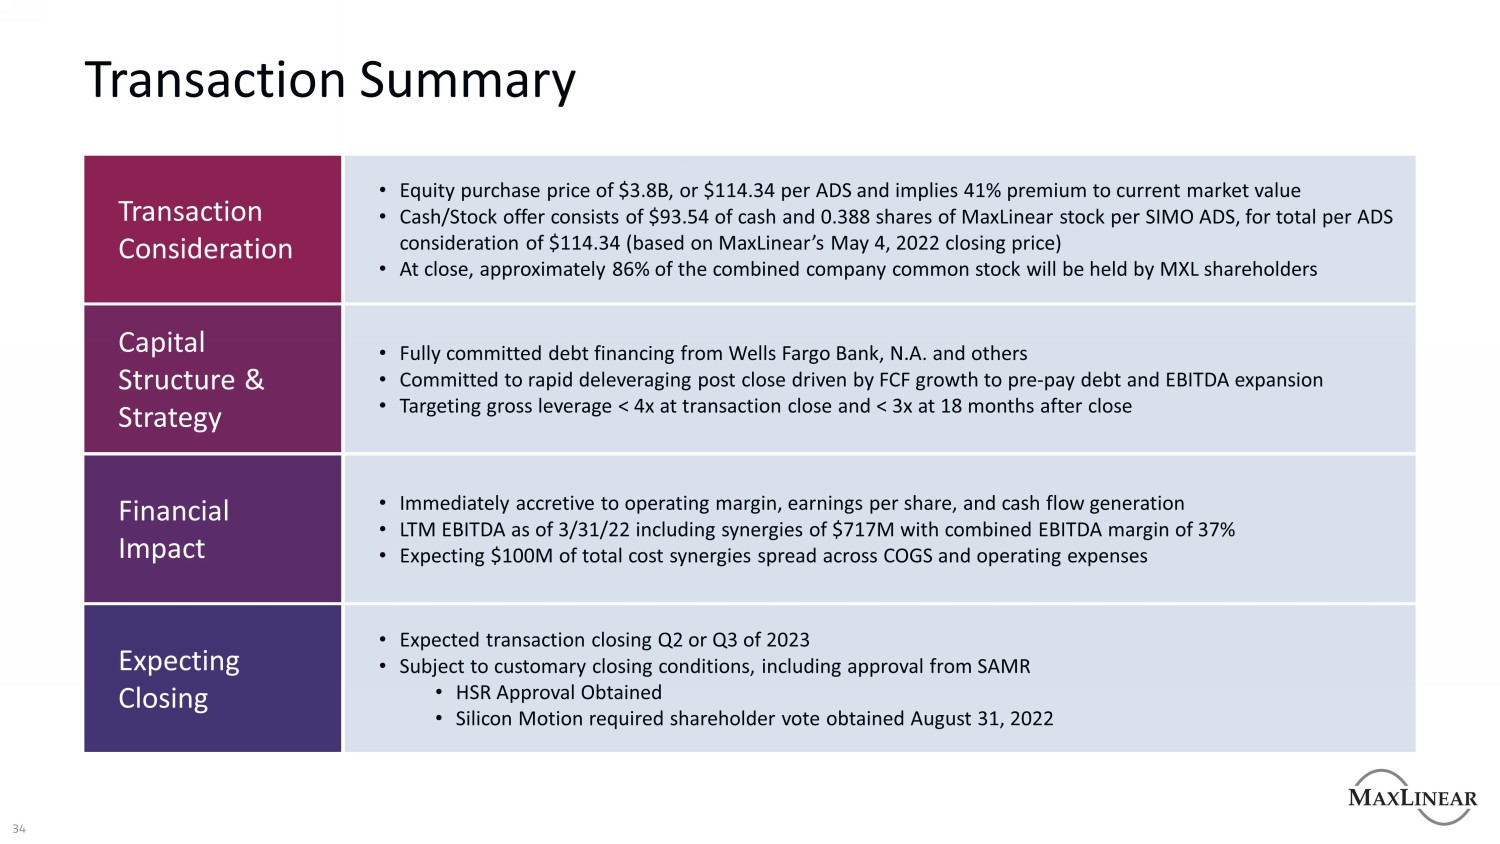
34 Transaction Summary Expecting Closing • Expected transaction closing Q2 or Q3 of 2023 • Subject to customary closing conditions, including approval from SAMR • HSR Approval Obtained • Silicon Motion required shareholder vote obtained August 31, 2022 Financial Impact • Immediately accretive to operating margin, earnings per share, and cash flow generation • LTM EBITDA as of 3/31/22 including synergies of $717M with combined EBITDA margin of 37% • Expecting $100M of total cost synergies spread across COGS and operating expenses Capital Structure & Strategy • Fully committed debt financing from Wells Fargo Bank, N.A. and others • Committed to rapid deleveraging post close driven by FCF growth to pre - pay debt and EBITDA expansion • Targeting gross leverage < 4x at transaction close and < 3x at 18 months after close Transaction Consideration • Equity purchase price of $3.8B, or $114.34 per ADS and implies 41% premium to current market value • Cash/Stock offer consists of $93.54 of cash and 0.388 shares of MaxLinear stock per SIMO ADS, for total per ADS consideration of $114.34 (based on MaxLinear’s May 4, 2022 closing price) • At close, approximately 86% of the combined company common stock will be held by MXL shareholders
Thank you